
SPX Monitoring purposes; Short SPX 6/26/17 at 2439.07.
Monitoring purposes GOLD: Long GDX on 6/22/17 at 22.36
Long Term Trend monitor purposes: Neutral.
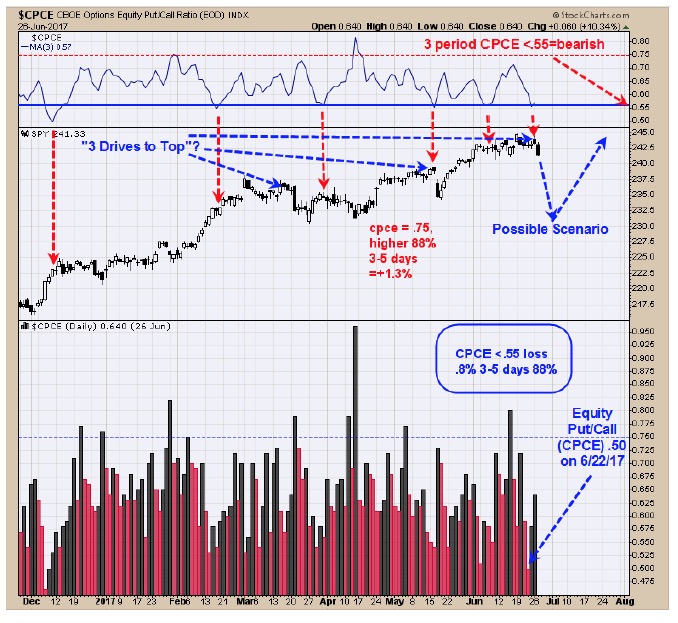
On Yesterday’s report we said, “The top window is the three day average of the Equity Put/Call ratio. The 3 day average of less than .55 have appeared near short term highs in the SPX. Last Thursday the Equity Put/Call ratio closed at .50. Readings less than .55 predict the market will be lower 88% of the time in the next three to five days with an average loss of .8%.” That prediction has been met. However, we have not recorded panic in the Tick and Trin combination readings yet suggesting the decline is not done. Short SPX on 6/26/17 at 2439.07.
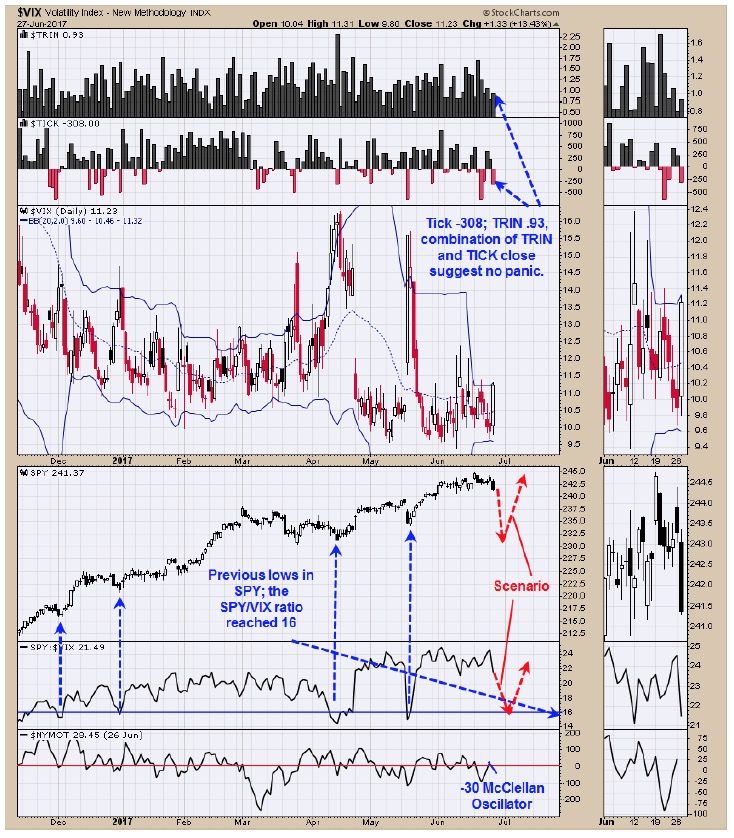 The bottom window is the McClellan oscillator which closed near -30 and below “0” and bearish. Next window up is the SPY/VIX ratio. Previous bottom in the SPY, the SPY/VIX ratio reached +16 range and today’s close came in at +21.49, suggesting the SPY/VIX ratio has not reached bullish levels yet. The TRIN closed at .93 and the Ticks at -308; which is not a bullish combination suggesting the SPY decline is not done. However the Nasdaq TRINQ closed 1.66 and the TICKQ closed at -245 which can be bullish but we have more experience in the TRIN and Ticks close and we are going by their readings. Next Tuesday is July 4 and markets are closed. Going into a Holiday the volume usually drops as traders take off early to enjoy the holiday. If the SPY continues to drop, the volume most likely will decrease going into the holiday and be a bullish sign especially if the SPY/VIX ratio reaches near +16. It still appears the “Three Drives to Top” that started back in early March that has been discussed in our reports is still in play which has a target near 2300 on the SPX. However if panic shows up in the TRIN and TICK combination we will cover our short SPX position. Ask for free 30 day trial.
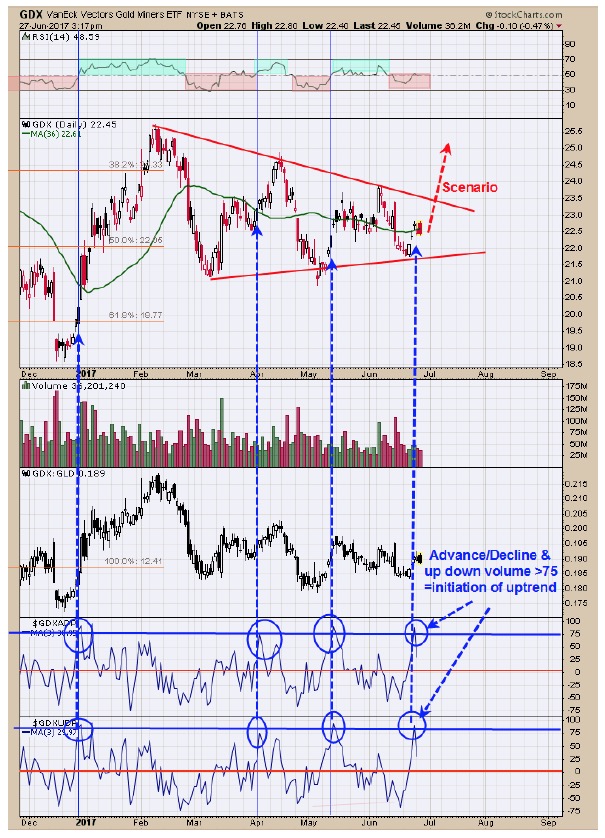
The bottom window is the Up down Volume percent indicator which reached above +75 and previous times that has occurred the last several months the market was in the early stages of a rally mode. Next window up is the Advance/Decline percent which also reached above +75 and previous times in the recent past that has occurred the market is in the early stages of a rally mode. Since both indicators reached over +75 the odds of a higher market in the coming weeks has increased. The pattern that appears to be forming is a “Triangle pattern” which normally breaks in the direction that preceded it, which is up in this case. Long GDX on 6/22/17 at 22.36.
Tim Ord,
Editor
For examples in how "Ord-Volume" works visit www.ord-oracle.com. New Book release "The Secret Science of Price and Volume" by Timothy Ord, buy on www.Amazon.com