"The trend is evident to a man who has an open mind and reasonably clear sight." -Edwin Lefevre, in Reminiscences of a Stock Operator
I have a series of ChartLists that I follow during the day as a way to get a sense of the overall market trend. One of the pages displays the four iShares MSCI factor ETFs, those that track Momentum (MTUM), Quality (QUAL), Size (SIZE), and Value (VLUE).
I’ve found this to be a great complement to other pages which track broad market indexes, market internals and sector and industry performance. By flipping through these pages, I can get a sense of what’s driving the market over time.
I decided to look at these ETFs over multiple time frames to get a better sense of relative performance. First, I looked at their performance year-to-date, and developed this chart.
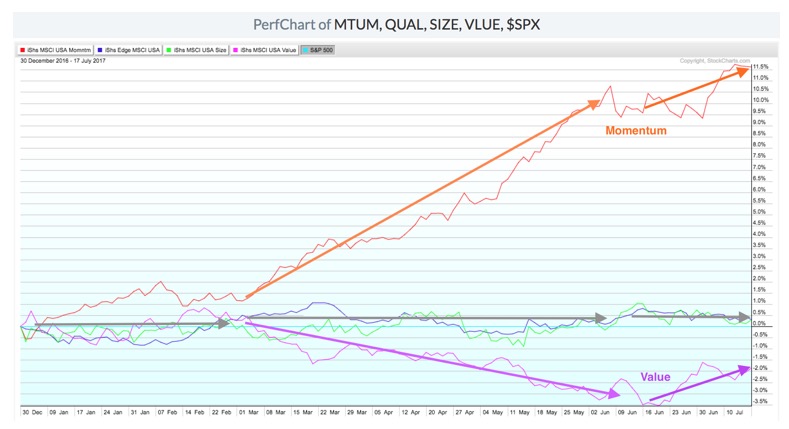
This shows the four factor ETFs relative to the $SPX. You’ll notice that in the first six weeks of the year, all four ended in line with the market. No real differentiation yet.
Starting March 1st, see how the Momentum ETF took off, outperforming the S&P by about 9% through the beginning of June? Value, on the other hand, underperformed by about 3% over the same time frame.
This is not surprising, as over half of the Momentum ETF is made up of financials and technology, but the chart tells a very compelling performance story.
In the last six weeks, both Value and Momentum have done well, while Size and Quality remain essentially in line with the market.
I then zoomed into the most recent performance using the CandleGlance page to get a better sense of the short-term movement.
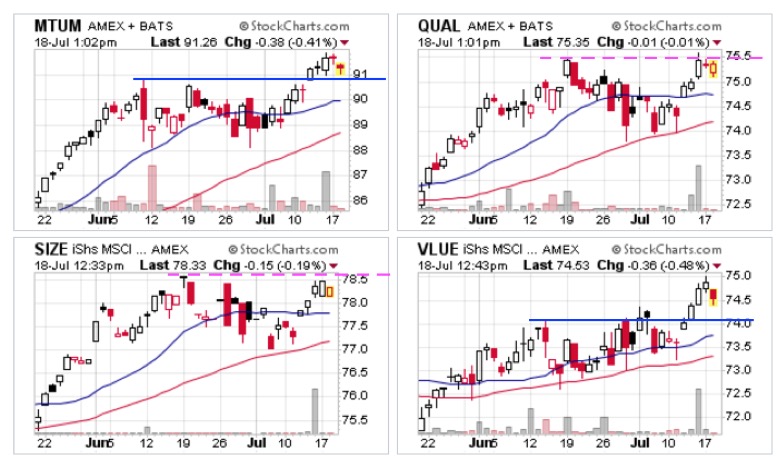
You’ll notice that both the Momentum and Value ETFs have broken through resistance, while Size and Quality ETFs have not.
As part of a concerted effort to chip away at my epic book collection, I recently read the book Quantitative Momentum: A Practioner’s Guide to Building a Momentum-Based Stock Selection System by Wesley Gray and Jack Vogel.
They make a strong case for active management using the well-documented phenomena of value and momentum outperformance over multiple cycles.
Time will tell if this is the beginning of a period of extended outperformance by momentum and value. As we continue through the seasonally weakest time of the year, I’ll be watching these charts to help answer that question.
David Keller, CMT
marketmisbehavior.com
David Keller, CMT is passionate about viewing the markets through the lenses of behavioral psychology and technical analysis. He is a Past President of the Market Technicians Association and currently serves as a Subject Matter Expert for Behavioral Finance. David was formerly a Managing Director of Research at Fidelity Investments in Boston as well as a technical analysis specialist for Bloomberg in New York. You can follow his thinking at marketmisbehavior.com.
Disclaimer: This blog is for educational purposes only, and should not be construed as financial advice. The ideas and strategies should never be used without first assessing your own personal and financial situation, or without consulting a financial professional.
