Using Three Indicators With Three Different Chart “Time Periods” Will Guide Your Decisions.
Semiconductor stocks rose 74% from June of last year to its recent peak in June with many individual stocks going even higher. As we all know, stocks don’t advance continuously so at some point, moves like this are prone to a pullback at the very least and in some cases a correction or worse.
My company follows high-quality growth stocks and so our interest in timing a potential uptrend reversal of Semiconductor stocks was heightened as many of the stocks we recommended in this area had tremendous moves.
For investors keen on spotting trend reversals in stocks, it’s important to note that there are 3 types of trends and which one you key in on will depend on your style of investing. Those 3 types of trends are near-term, intermediate term and long term.
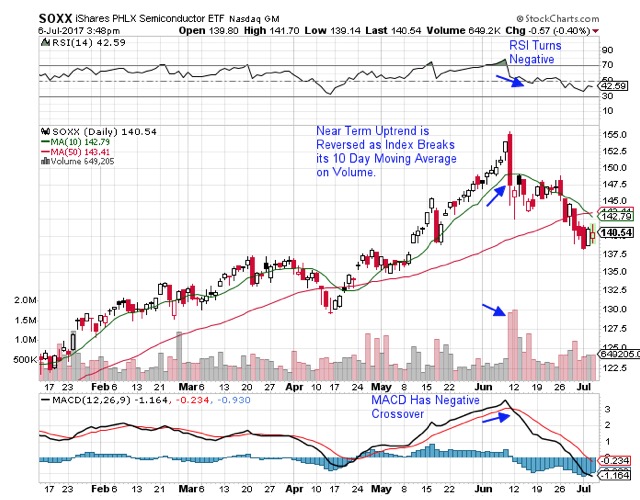
For those that have a shorter- term trading horizon (and a low tolerance to giving up any gains) you would pay attention to the near-term trend. This trend is uncovered by using a Daily Chart overlaid with the RSI, 10 and 50 day Moving Averages and MACD.
As you can see below, the near-term uptrend of Semiconductors is reversed when the Index breaks below the shorter term 10 day moving average and it is on volume. This is accompanied by a negative crossover of the MACD as well as the RSI. From our work, this action would indicate that new positions should be avoided however, with the intermediate-term uptrend still in place, (i.e. 50 day mav in an uptrend and not broken) we would be inclined to stay with our positions until further evidence dictates that we should sell.
DAILY CHART OF SEMICONDUCTOR ETF
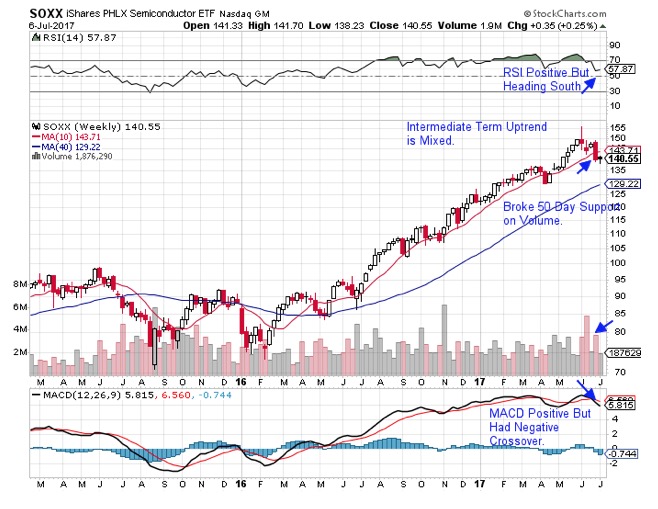
For those of you that have stayed with this strong group, the next clue to the reversal of its uptrend would be to use a weekly chart for the Intermediate trend. In this case, it would be a break below its 50-day moving average on volume as well as the position of the RSI and MACD. As you can see below, we did get that break below the 50 day MAV and from our work, the Intermediate trend has been broken.
However, while the MACD had a negative crossover, it is still above its “zero-line” and the RSI is trending downward but has not quite broken into negative territory (below 50). These mixed signals can be confusing so again, your trading style will dictate your reaction. A longer-term trader (i.e buy and hold) can stay with the group as the 200 day is still in an uptrend and RSI and MACD are not quite negative but from our work, a break below its 50 day moving average on volume is a negative that we would pay attention to.
WEEKLY CHART OF SEMICONDUCTOR ETF
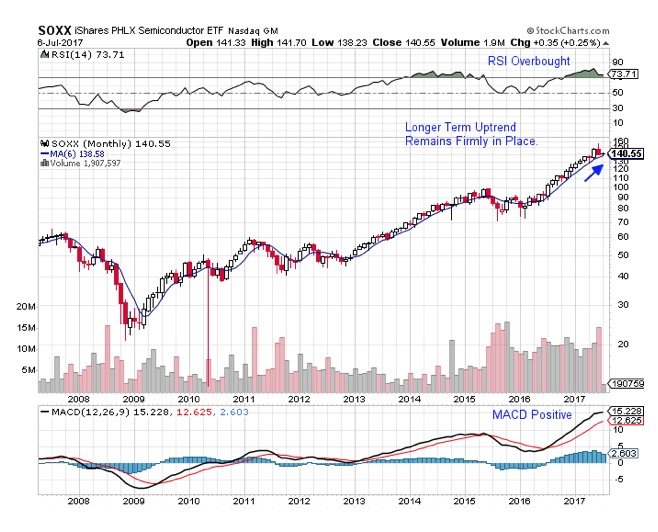
 Lastly, let’s take a look at the much longer-term trend. We will do this by looking at the monthly chart and use a 6-month moving average. Monthly charts are used by many of the professional money managers I work with and it is very useful in providing a much longer outlook for a group or a stock.
As you can see in the chart below, the longer-term uptrend remains firmly in place as the ETF is finding support at its upward trending 6 month moving average. This is despite last month’s 7.8% drop. The RSI remains quite positive in an overbought position and the MACD has not had a negative crossover and remains well above its zero line. As you can see, the longer term monthly chart smooths out the daily choppiness and can keep you in a trade for a lengthier period of time.
MONTHLY CHART OF SEMICONDUCTOR ETF
 As we all know, there are many ways to profitably trade the markets. By becoming familiar with the different signals that a different time frame chart can provide, you can help fine tune your trading to match your style.
For those that are interested in tutorials on how to refine your trading, you can reach us at our website link below.
Mary Ellen McGonagle
MEM Investment Research
www.memInvestmentresearch.com