
SPX Monitoring purposes; Short SPX on 8/30/17 at 2457.59.
Monitoring purposes GOLD: Neutral
Long Term Trend monitor purposes: Neutral.

The pattern forming on the hourly chart appears to be a Head and Shoulders top where the Head is last Monday, Tuesday and Wednesday trading. Market could trade sideways a couple more days to form the “Right Shoulder”. This potential hourly “Head and Shoulders Top” has a downside target to the September 11 gap and could find minor support there. A test of the September 11 gap on higher volume will suggests the gap will fail and market will continue lower. A gap test on lighter volume will suggest the gap has support, we will have to see what the volume is if and when its tested. The bigger “Three Drives to Top” that started back in June has a downside objective to 2400 on the SPX and our intermediate term target. The McClellan Oscillator hit -246 on August 10, suggesting a consolidation on average that could last two months or longer. Short SPX on 8/30/17 at 2457.59
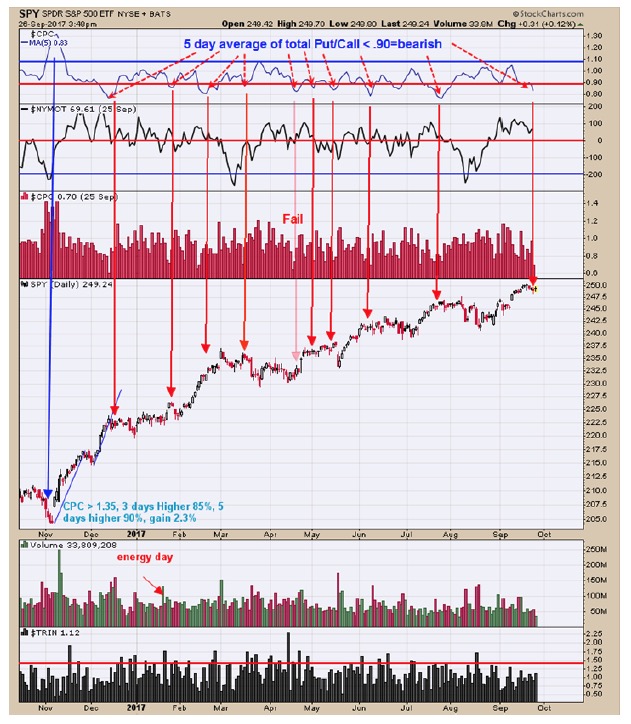 The top window is the 5 day average of the Total Put/Call ratio; readings below .90 on this ratio have appeared near short term tops. The current reading on this ratio is .83. This sentiment indicator suggests at best the market will move sideways or at worst, turn down. The “Three Drives to Top” we have discussed on previous reports appears still in play. The current setup could lead to a potential pull back that could reach 2400 range on the SPX which is near 4%. The McClellan oscillator closed today near +67; a close below “0” would be another bearish sign. Short SPX on 8/30/17 at 2457.59.
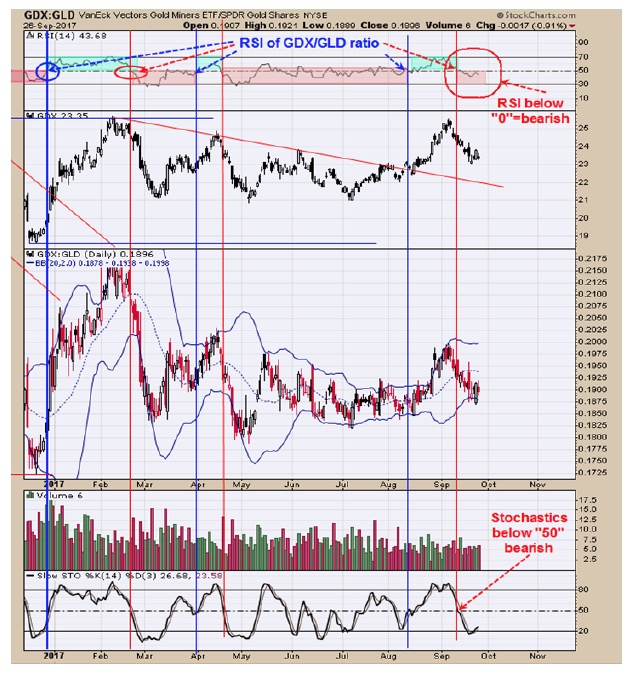 The last report for the COT Commercials came in at 253K short and the previous week at 272K short both of which are bearish. Bullish condition for gold and gold stocks is when the GDX/GLD ratio is rising. The top window is the RSI for the GDX/GLD ratio. When the RSI for the GDX/GLD ratio is above 50 and bullish condition is present for this ratio and when below 50 a bearish condition. The bottom window is the Slow Stochastics for the GDX/GLD ratio; when this indicator is above 50 a bullish condition is present and when below 50 a bearish condition. Both indicators are below 50 suggesting GDX/GLD ratio is in a downtrend, which is a bearish sign for both gold and gold stocks. The RSI and Stochastics could flip above and below 50 a couple for more times before the major bottom is due in December. Right now market is trying to find footing for a bounce which could be a minor “B” up before the final “C” wave down which could complete this sideways consolidation that has been going on since February. Staying neutral for now.
Tim Ord,
Editor
Visit www.ord-oracle.com. New Book release "The Secret Science of Price and Volume" by Timothy Ord, buy on www.Amazon.com.