
SPX Monitoring purposes; Neutral
Monitoring purposes GOLD: Covered short GDX at 23.23 on 10/20/17 =gain 2.56%; Short GDX on 10/13/17 at 23.84.
Long Term Trend monitor purposes: Neutral.
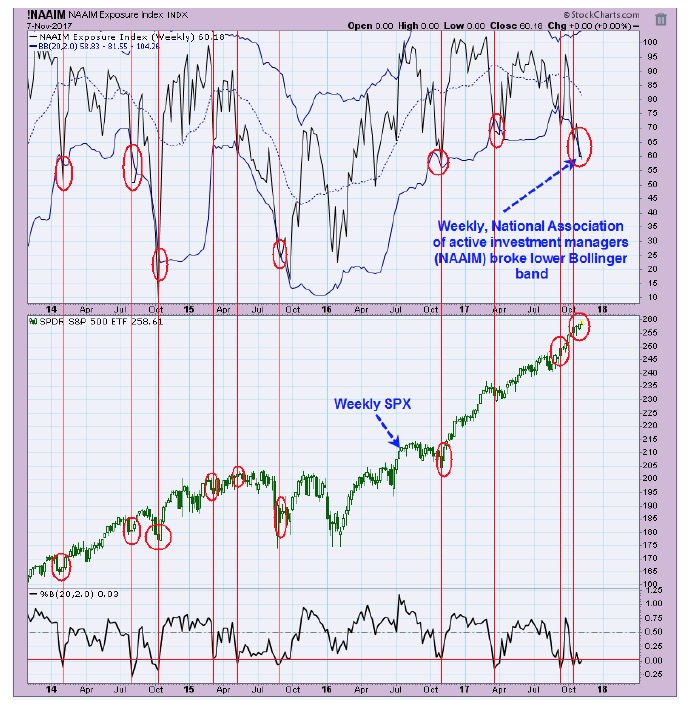
The above chart is the weekly National Association of active Investment Managers (NAAIM) compared to the SPX. When the NAAIM reaches the lower Bollinger Band (like now) the SPY is near a low. We have circled in red the times when the NAAIM broke its lower Bollinger Band and where is corresponded to the weekly SPX. This chart suggests if there is a pull back in the SPX it should be bought. The question becomes, will there be a pull back and how much. This is the week before option expiration and whipsaws are common and could open the door for a pullback. Patience is needed for now.
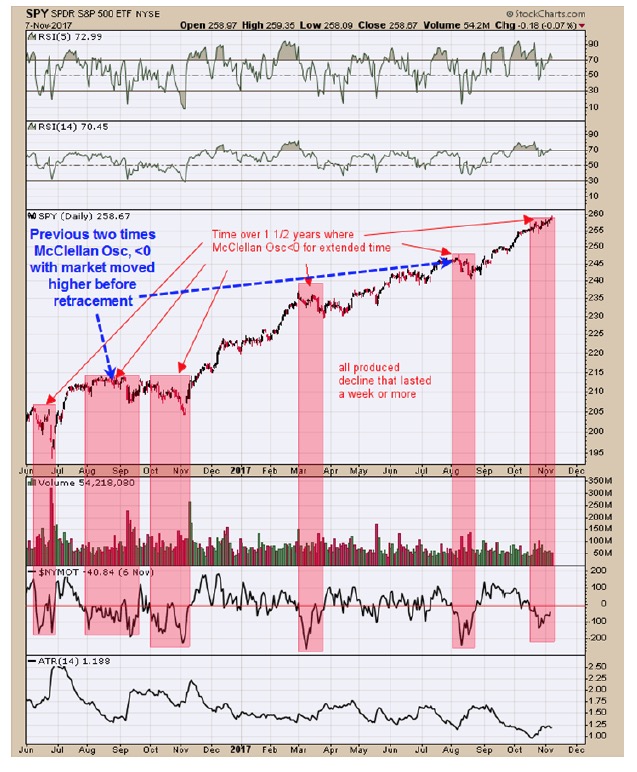 The chart above goes back 1 1/2 years and shows the times when the McClellan Oscillator was below “0”. In all the case shown the market did move lower at some point when the McClellan Oscillator was <”0”.. The two times pointed out on the chart with blue arrows show the times where McClellan Oscillator was below “0” and for a short time the market still moved modestly higher but in the end still produced a pull back. This is the week before option expiration week and a week to be careful as whipsaws are common. We thought at one point that 254 on the SPY (2540 SPX) was a possible downside target, with the NAAIM in bullish territory, it would seem unlikely for that large of a pull back. With option expiration week next week (normally has a bullish bias) and this week which is known for whipsaws, this week is a good candidate for the pull back.
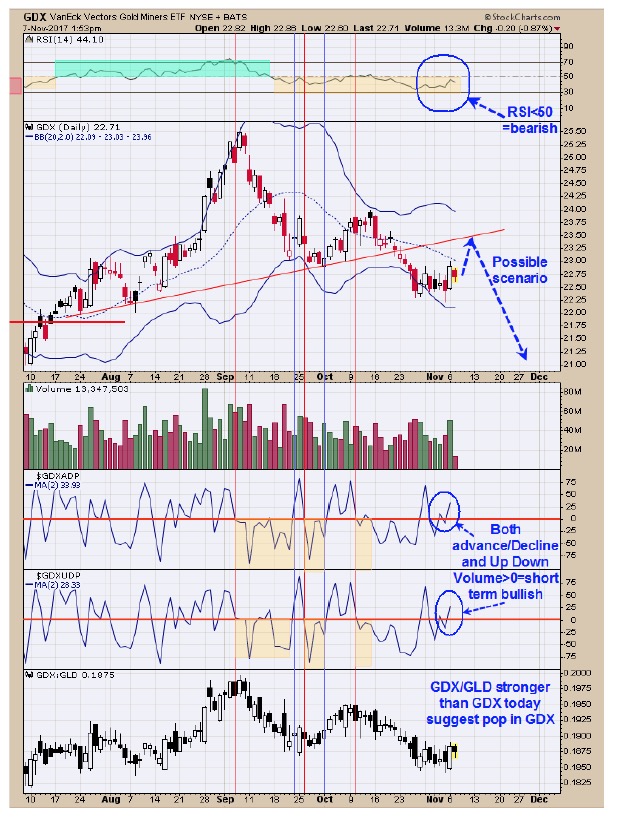 There is a cycle low due around December (+ or – a month). For very short term both Advance/Decline and Up down volume indicators are back above “0” and a short term bullish sign. The area of resistance on this potential bounce is trend line resistance near 23.50 which could represent a “B” wave high and a possible sell signal could develop in that range. The pattern forming Since the October high could be ABC with “C” having a measured target near 21.25 range. Today GDX/GLD ratio outperformed GDX and a bullish sign short term. With the Mid Bollinger Band trending down and the RSI below 50, suggests the larger trend is still down. The COT Commercials still short around 211K and still in the bearish camp. Neutral for now on GDX.
Tim Ord,
Editor
Visit www.ord-oracle.com. New Book release "The Secret Science of Price and Volume" by Timothy Ord, buy on www.Amazon.com.