
SPX Monitoring purposes; Sold long 12/11/17 at 2659.99 = gain 1.17%; Long SPX on 12-6-17 at 2629.27.
Monitoring purposes GOLD: Covered short GDX 12/12/17 at 21.40=gain 5.14%; Short GDX on 11/13/17 at 22.56
Long Term Trend monitor purposes: Neutral.
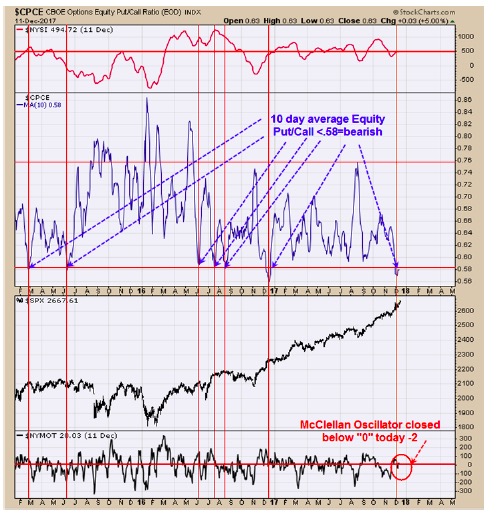
This is option expiration week and option related indicators carry more weight during this time period. The chart above goes back near three years and shows the times when the 10 day average of the Equity Put/Call ratio reached .58 or lower. At best the market went sideways when this ratio reached .58 and at worst produced a decent decline. FOMC is today and tomorrow with the announcement tomorrow at 2:00 Eastern and could be catalysis for a pull back. The bottom window is the McClellan Oscillator which closed at -2 and below “0” and a bearish sign. A possible target for a low is the December low of 260 range on the SPY.
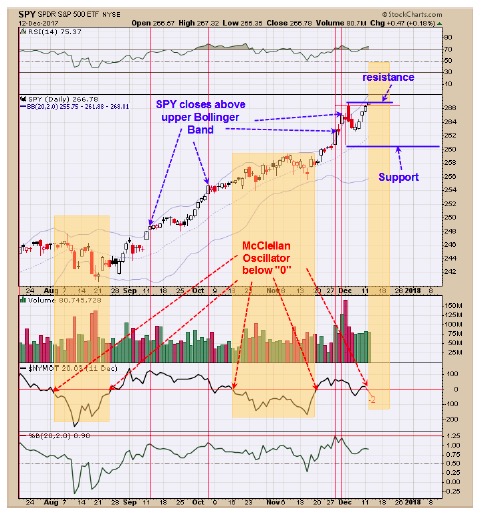 Today’s rally tested the previous high on near half the volume and a bearish sign. Though the market was up today the McClellan Oscillator fell though “0” and closed near -2 and another bearish sign. The tan area shows when the McClellan Oscillator was below “0” and what the market did in that time frame. The rally into the recent highs closed above the upper Bollinger Band twice which can represent exhaustion. The December option expiration (this week) has a 50/50 chance of closing higher where other option expiration weeks have over a 70% chance closing higher. Market has trended higher since September and a trading range is due. The bigger trend is up but a possible pull back to support near 260 on the SPY is possible. Tomorrow’s FOMC meeting announcement could be a catalysis for a pull back. Sold long 12/11/17 at 2659.99 = gain 1.17%; Long SPX on 12-6-17 at 2629.27
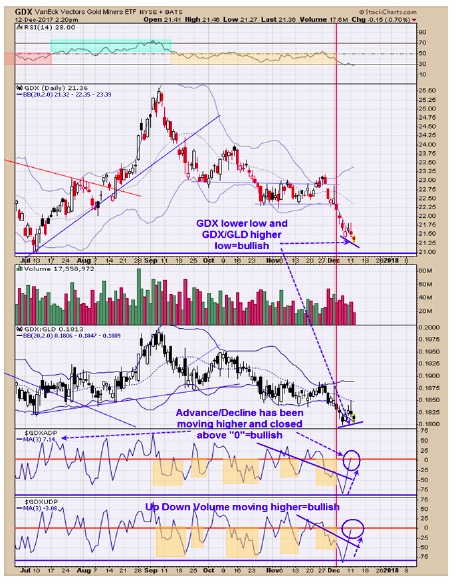 The COT Commercials covered their short position to 190K down from 247K the week before, showing a bullish slant. Bottoms show up in gold when the Commercials are near 100K or less. The bottom window is the Up/Down volume indicator which has been moving higher as GDX moved lower and a positive divergence. The next window up is the Advance/Decline indicator which also has been moving higher showing market is gaining strength; It also closed above “0” and a bullish sign. The middle window is the GDX/GLD ratio which has made higher lows as GDX made lower lows and a bullish sign. There is a horizontal trend that started back in March that comes in near 21.00 on GDX could be where GDX makes its low. It appears a bottom is not far off for GDX and we covered our short position on 12/12/17 at 21.42=gain of 5.14%; short GDX on 11/13/17 at 22.56.
Tim Ord,
Editor
Visit www.ord-oracle.com. New Book release "The Secret Science of Price and Volume" by Timothy Ord, buy on www.Amazon.com.