As the US Dollar continues to strengthen, it’s worth revisiting the bullish thesis to evaluate potential future paths. Overall, the Dollar remains in a positive configuration with further upside in the UUP to around 25.35.
Back in late April, we reviewed the breakout in the Dollar using this chart of the Bullish Dollar ETF (UUP).
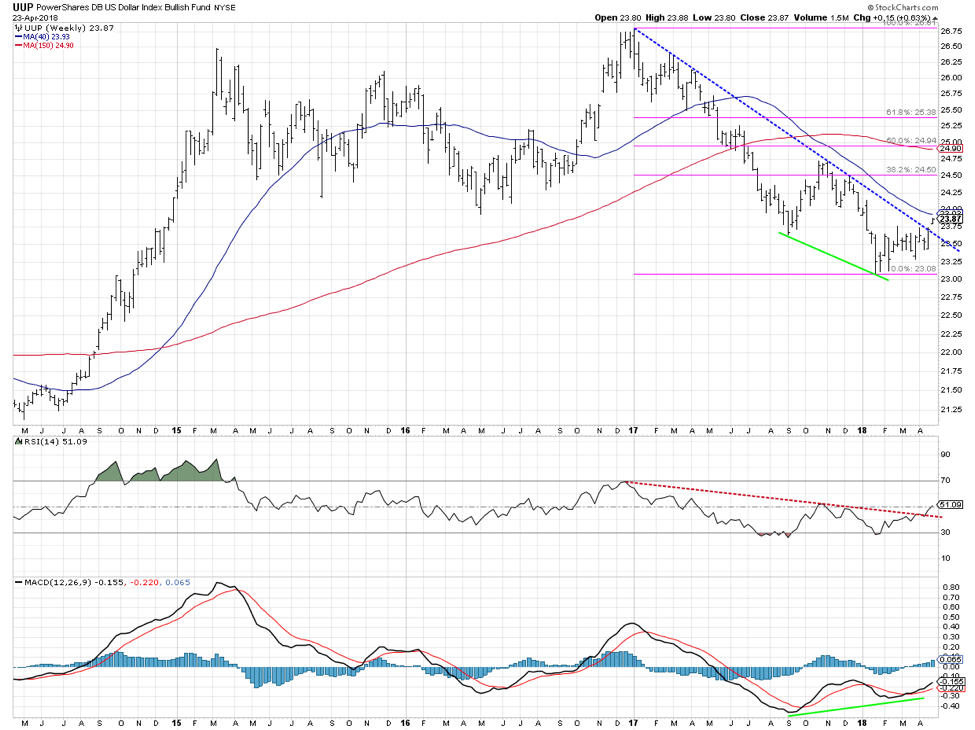
The trendline breakout lined up with a bullish divergence from the weekly MACD and a confirmation from the weekly RSI. The weekly Fibonacci retracement gave us an upside objective of around 24.50.
We then looked at the daily chart and found that a measured move based on the height of the base gave us a minimum upside objective around 24.50 as well.
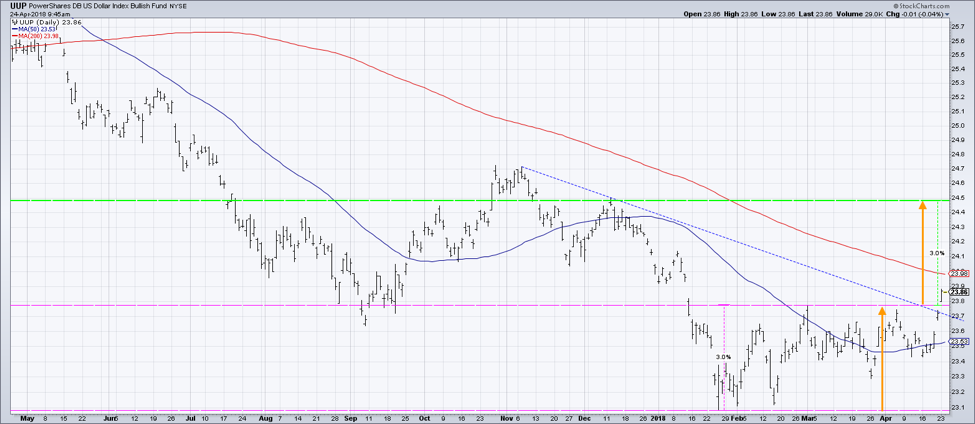 Now let’s look at some updated price charts to see where we’re at relative to these price objectives from late April.
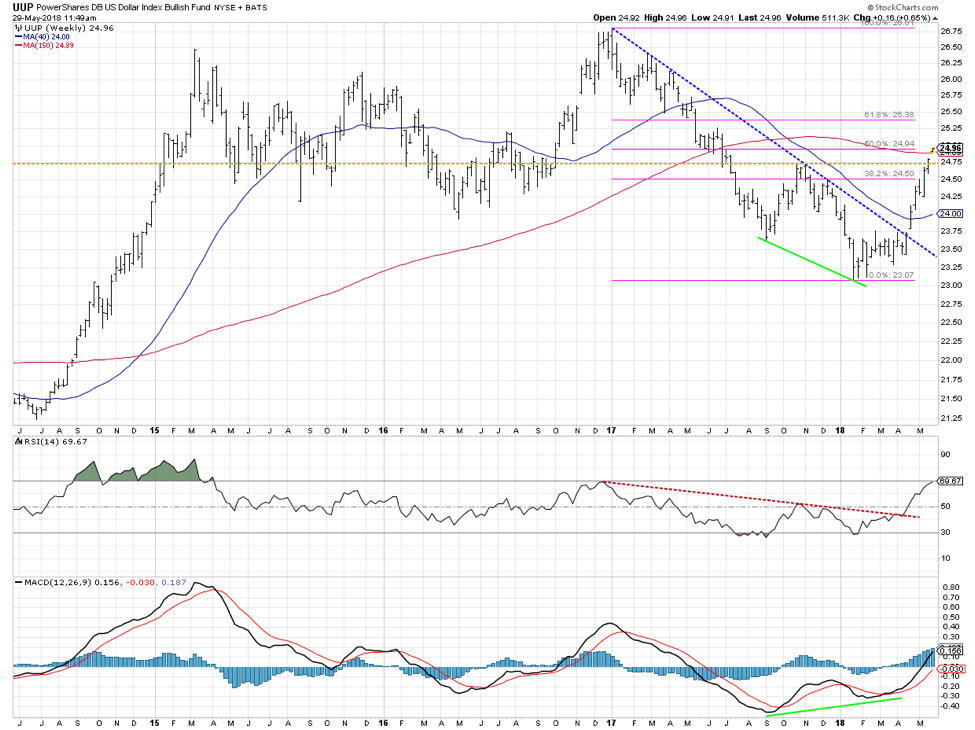 The UUP barely took a breath as it eclipsed its 200-day moving average. The UUP also broke above it October 2017 high, confirming the strength of the recent uptrend.
It has now reached its 150-week moving average, which it has been below since June 2017. A confirmed break above this long-term smoothing mechanism would be another confirmation of a longer-term uptrend. Coincidentally, this level lines up with a 50% retracement of the 2017-2018 selloff. Legendary trader W.D. Gann stressed the importance of the 50% level in his writings.
The weekly RSI is nearing an overbought condition, although a glance to the left side of the chart shows how the UUP can remain overbought for quite a long time in an extended uptrend.
On the daily chart, we get a better sense of how quickly the dollar has blown through key resistance levels.
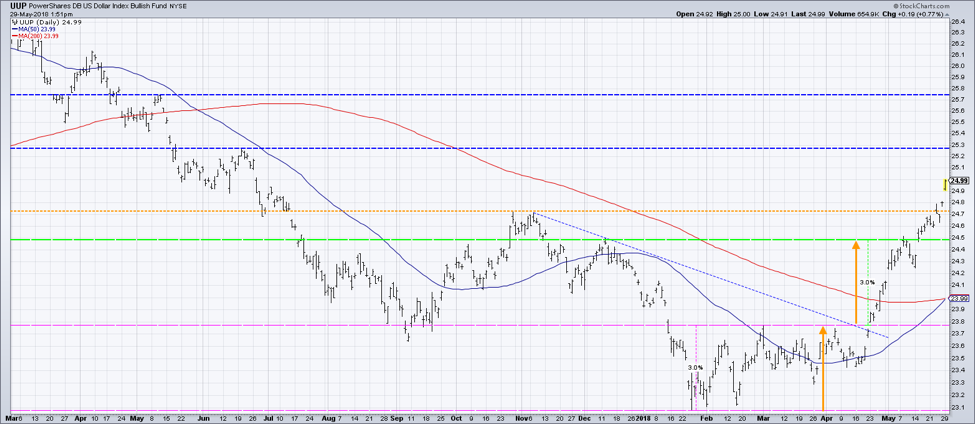
It’s interesting to note that the next resistance level is around 25.30. This lines up fairly well with the 61.8% Fibonacci retracement level from the weekly chart, which lies around 25.38. This equates to resistance on the US Dollar Index ($USD) chart around 97.50-98.00.
When a market is in a confirmed uptrend, resistance levels can be important points at which to reevaluate your outlook and positioning. Most importantly, remember that as long as the Dollar puts in higher highs and higher lows, the trend is up!
David Keller, CMT
President
Sierra Alpha Research LLC
David Keller, CMT is President of Sierra Alpha Research LLC, a boutique investment research firm focused on managing risk through market awareness. He is a Past President of the Chartered Market Technicians Association and most recently served as a Subject Matter Expert for Behavioral Finance. David was formerly a Managing Director of Research at Fidelity Investments in Boston as well as a technical analysis specialist for Bloomberg in New York. You can follow his thinking at marketmisbehavior.com.
Disclaimer: This blog is for educational purposes only and should not be construed as financial advice. The ideas and strategies should never be used without first assessing your own personal and financial situation, or without consulting a financial professional.
The author does not have a position in mentioned securities at the time of publication. Any opinions expressed herein are solely those of the author, and do not in any way represent the views or opinions of any other person or entity.
