SPX Monitoring purposes; Sold SPX 3/28/19 & 2815.44= gain .61%; Long 2798.36 & 3/25/19.
Monitoring purposes GOLD: Long GDX on 1/29/19 at 21.96.
Long Term Trend SPX monitor purposes; Long SPX on 10-19-18 at 2767.78
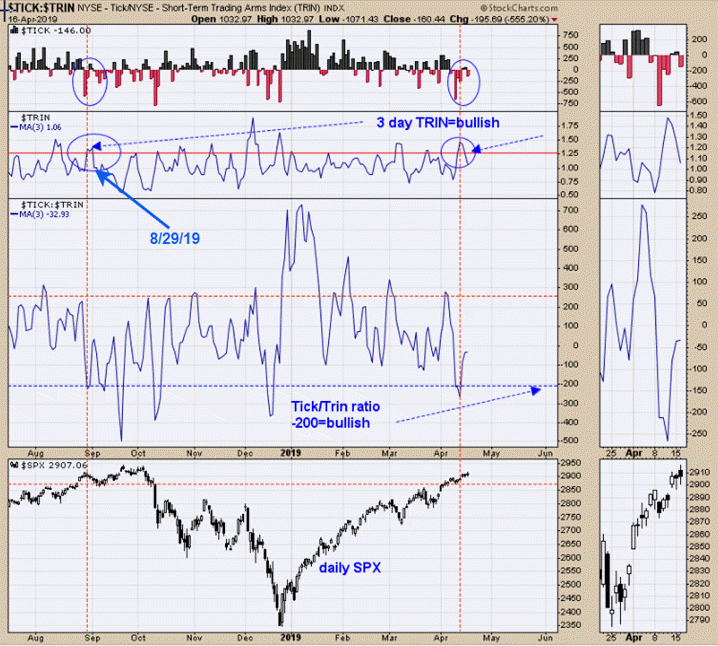
 The second window down from the top is the 3-period moving average of the TRIN. Readings above 1.30 are normally bullish if they come after a decline in the market. If the 3-period MA TRIN readings come when the market has rallied, that can be a bearish sign; and that is what we have here. It's rare during a rally that the 3-period MA of the TRIN reaches above 1.30 and the last time it has done that came on 8/29/18. The pullback back then was modest and the same modest pull back may materialize here. A possible better setup, if the market does pull back, would be to wait for the next bullish setup.
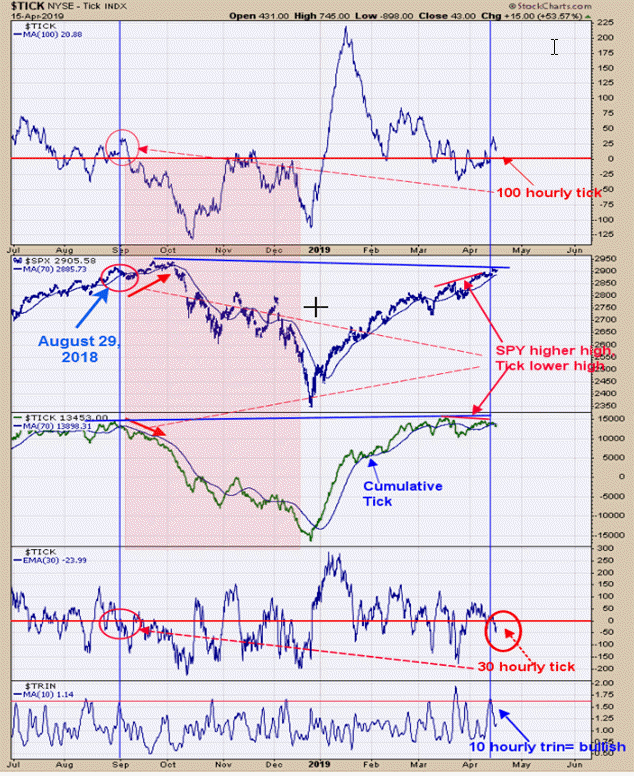
 The 100-hour MA, 30-hour MA and cumulative Tick are acting a lot like in the August 29, 2018 time period. Back then, the 30-hour MA of the Tick was trading below “0” as SPX was topping out, just like now, and the cumulative tick fell below its moving average, just like now. The 100-hour Tick was holding above “0” last August, just like now. And both time periods produced 30-hour MA of the TRIN above 1.60. The pull back wasn’t great back in August and if there is a pull back here it should be shallow also. Seasonality is very favorable right now and the Ticks are showing weakness, not an ideal setup for a trade. I also might add that both the Total Put/Call and Equity Put/Call reached bearish levels last Friday, which suggests weakness over the next five days. Remain bullish intermediate-term and neutral short-term. We have been posting this phrase on the last several reports: “Fun statistics, is that with VIX under +16 and SPX up +10% last 3 months, April is higher 90% of the time averaging 2.75% gain.” This could mean that if there is a pullback it should be shallow and a bullish setup could form next week.
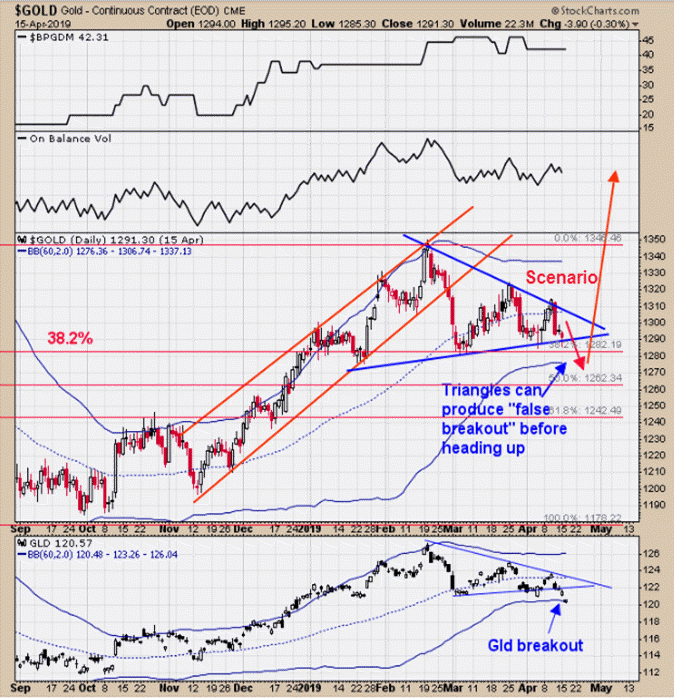
 The above chart is the daily Gold chart, which is updated after the close, and the bottom window is the ETF for Gold (GLD) with current updated prices. Yesterday, we said “Gold appears to be drawing a 'Triangle Pattern.' 'Triangle Pattern' usually follows the direction that preceded it, which is up in this case. It's also common for 'triangles' to have a 'False' breakout before reversing higher and that could happen here.” It appears a false breakout is occurring on GLD. We mention on past reports that there is a cycle low due mid-April to early May and we are in that time zone now; a pullback in that timeframe would suggests an important low is near. So far the pullback on Gold has only retraced 38.2% and if the retracement in general holds that Fibonacci level, it bodes well for the longer term, as it would mean the current consolidation would mark the halfway point of the move up. This would give a target near 1460 range for gold. If gold goes up so will gold stocks and GDX. Long GDX on 1/29/19 at 21.97.
Tim Ord,
Editor
www.ord-oracle.com. New Book release "The Secret Science of Price and Volume" by Timothy Ord, buy at www.Amazon.com.
