|
|
SPX Monitoring purposes; Sold long SPX on 7/22/19 at 2985.07= small gain; Long 7/17/19 at 2984.42.
Monitoring purposes GOLD: Long GDX on 1/29/19 at 21.96.
Long Term Trend SPX monitor purposes; Sold SPX 7/5/19 & 2990.41= gain 2.63%; Long SPX on 6-26-19 at 2913.78.
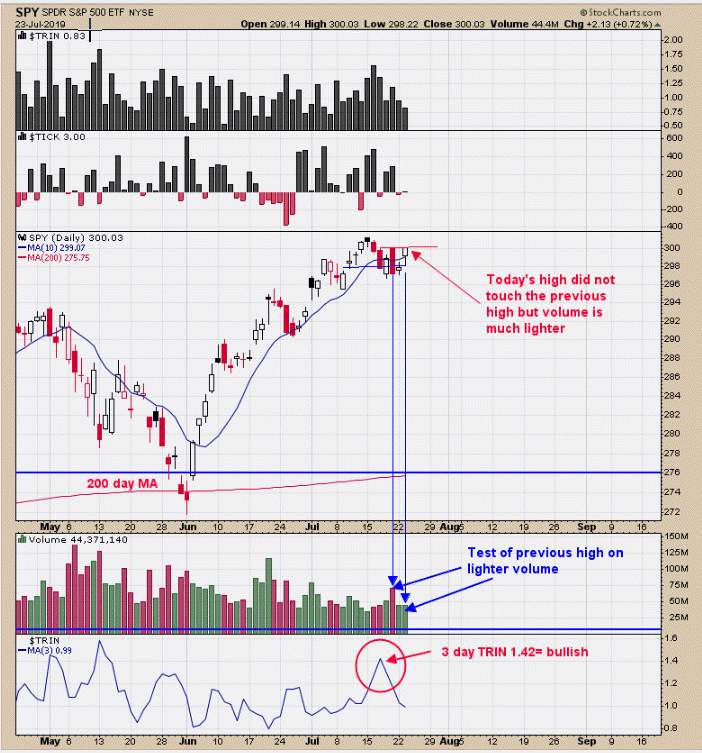
 SPX rallied today (wouldn’t you know it) and is now testing Friday’s high on much lighter volume. Today’s high did not touch Friday’s high, so technically the test has not happened yet. Ideally, a break of the previous high is needed to confirm a bearish sign. To get through Friday’s high, the volume needs to be equal to or greater than Friday’s volume, which was 71M. If the touch does come tomorrow and volume is 10% less than 71M, a bearish sign will develop. The FOMC meeting is next Tuesday and Wednesday and the market could bounce around in a trading range until then, not developing a strong signal (long or short). Page two shows the VIX relationships.
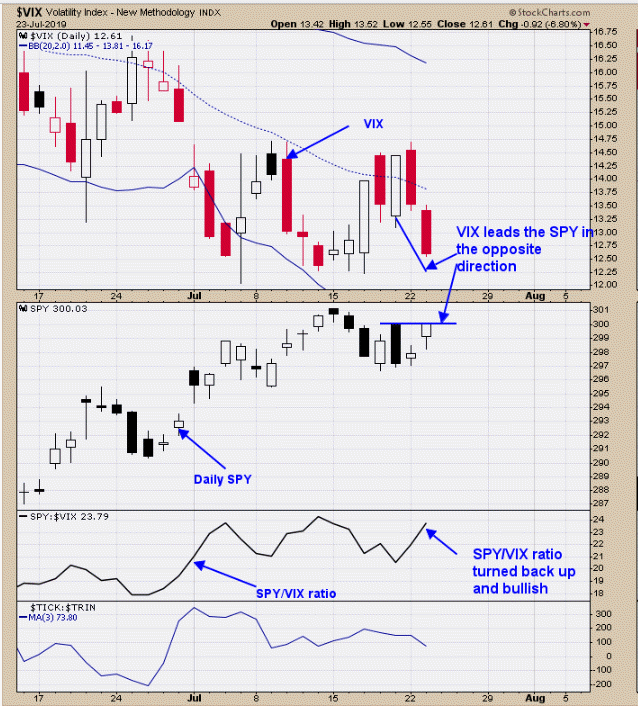
 Above is the VIX, along with the SPY chart. VIX leads the SPY in the opposite direction. Notice that VIX closed below Friday’s low and SPY is testing Friday’s high. VIX is showing more weakness than SPY is showing strength, a short-term bullish sign for the SPY. This relationship can be seen by the SPY/VIX ratio. When this ratio is rising, it shows that SPY is outperforming the VIX, a bullish sign for the SPY. I might add that the 5-minute cumulative TICK and the 5-minute TICK have both closed bullish, a bullish sign short-term. We showed on page one that volume leans bearish and puts the buy sale scale to neutral. We are staying on the sidelines for a better setup than what is present now. Sold long SPX on 7/22/19 at 2985.07= small gain; Long 7/17/19 at 2984.42.
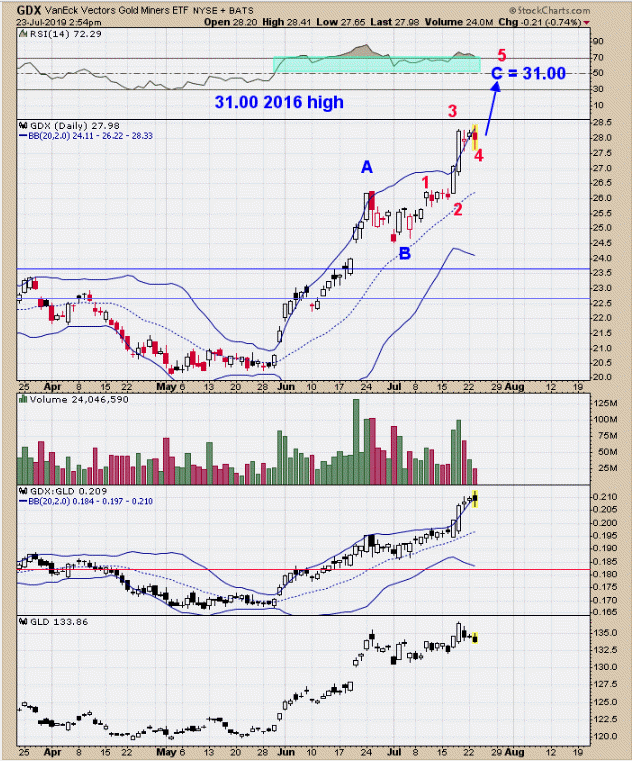
 Above is the daily GDX going back to April. The pattern forming could be an “ABC” Elliott Wave. The “C” wave appears to be in progress now. The “C” wave breaks down into a potential five count up and minor wave 4 is in progress now. Once minor wave 4 is completed then wave 5 starts up, with a target near 31.00 on GDX. ABC pattern have symmetry where wave “A” and “C” are equal a lot of the time. If that turns out to be the case here, then Wave “C” would have a target near 31.00 also. The 31.00 area is the 2016 high and a resistance area. For now, the 31.00 levels looks like a natural target level and a resistance area. If the 31.00 level is reached, it doesn’t mean that it’s the final high, but rather a resting place where market may consolidate for a while, after which higher highs are reached later. Long GDX on 1/29/19 at 21.97.
Tim Ord,
Editor
www.ord-oracle.com. New Book release "The Secret Science of Price and Volume" by Timothy Ord, buy at www.Amazon.com.

