Well, I suppose it depends on your view and what you believe in. For me, there's no question about it. The stock market can be timed as history repeats itself over and over and over again. The stock market timing that I'm talking about, though, isn't concerned about fundamental or technical analysis. I'm not talking about jumping in and out based on price action, moving averages, etc. Instead I'm referring to timing based solely on the calendar. Yep, you heard me right - the calendar!
How could the calendar hold clues for us? After all, every day is created equal in terms of stock market performance, right? Isn't it all random? I say no, it's not random and I'm going to explain why. Before I get into the numbers, let's talk a bit about theory.
During my days in public accounting it was obvious that many businesses had 401(k) plans that allowed employees to withhold money from paychecks to be disbursed to their retirement accounts. Not all, but many of those businesses had payrolls that were paid the 15th and 31st of the month. Companies aggregated the 401(k) withholdings of all their employees at those payroll dates and then wired the money to their mutual fund company. Mutual funds take directions from the 401(k) participants as to which funds to invest in and they follow those instructions immediately upon receiving the funds. They do not try to determine when the best time to invest is. They take the money and put it to work. That tells us that billions of dollars are put to work in the stock market early in the calendar month and then again mid-month. As a result, the stock market tends to move higher during those periods. But the 3-5 days leading up to those stock market inflows also tend to be quite strong as money managers, market makers, etc. are buying in anticipation, leading to a legal form of "frontrunning".
In a nutshell, the stock market is all about Economics 101. It goes higher when demand outstrips supply and down when supply overwhelms demand.
Now let's talk numbers.
The first thing you need to realize is that the S&P 500 has advanced 53.35% of the days since 1950. It's also posted annualized gains of approximately 9.00% over that same span. So as I discuss performance on the S&P 500 throughout the calendar month, please keep these two numbers - 53.35% and 9.00% - in mind.
After accumulating the daily performance of the S&P 500 since 1950 in an Excel spreadsheet, I began sorting the data to determine if any historical tendencies emerged. Several became quite obvious. The most startling historical tendency indicated that ALL of the S&P 500 gains since 1950 had occurred from the 28th of one calendar month through the 6th of the subsequent calendar month. In other words, 10 consecutive calendar days within the month accounted for ALL of the S&P 500 gains over a 65 year period. That's simply amazing. One third of the month accounts for all of the gains. Needless to say, with everything else being equal, the best time to buy stocks is no doubt the 27th of the month - at least based on history. By the way, what's today's date? Oh, that's right - the 27th. Hhhhhmmmmm.
Here's the breakdown of each calendar day during this bullish period - first the annualized return since 1950 with the percentage of days higher in parenthesis:
28th: +20.21% (57.04%)
29th: +19.63% (52.07%)
30th: +11.82% (52.17%)
31st: +33.95% (58.84%)
1st: +46.63% (61.38%)
2nd: +38.35% (59.13%)
3rd: +26.53% (57.06%)
4th: -0.23% (53.86%)
5th: +30.09% (56.29%)
6th: +16.39% (54.23%)
We're talking about a very large sample size here. This data dates back to 1950, or 65 years worth of information. And remember there are 12 calendar months in each year so the fact that this period outperforms the "norm" by such a wide margin in terms of both annualized gains AND percentage days higher is noteworthy and statistically relevant. Simply put, it's all about money flow.
The four calendar days that follow these ten bullish calendar days are dismal, as you might expect. These are profit taking days. I won't give you the individual daily details but the period as a whole produces NEGATIVE annualized returns of 6.63% and the percentage of days higher? How about 50.76%, well below what we saw in the previous 10 days.
Then it's all about "rinse and repeat". The 11th through the 18th is similar to the 28th through the 6th period. The anticipation of money flow, then the actual money flow produces higher prices historically. The overall period produces annualized returns of 13.68% and the S&P 500 has moved higher 54.60% of the days during this period since 1950.
Finally, we move into what I believe is the most bearish historical period - the 19th through the 27th. Not only does money flow subside, but we also have to deal with the monthly expiration of options. If the stock market tends to move higher from the 11th through the 18th, that leaves many market makers on the wrong side (short side) of options trades. That can be taken care of by a bit of selling, however. During this period, the S&P 500 has a NEGATIVE annualized return of 4.82% and the S&P 500 has moved higher just 50.52% of these days since 1950.
So please explain to me how the 28th to the 6th produces annualized returns of 24.05% and moves higher 56.12% of the days while the 19th to the 27th produces annualized returns of MINUS 4.82% and moves higher just 50.52% of the time? That's a 29 percentage point spread between the two and the sample sizes are VERY LARGE. The 28th-6th period comprises 4,957 trading days while the 19th-27th period totals 4,778 trading days.
Remember that these are TENDENCIES. Note that none of these statistics ever say 100%. Many times it's only slightly higher than 50% so don't look for guarantees. Instead, I use this information as simply "one more indicator" in my trading. If the technical indications say it's time to buy and historical tendencies support that notion, it gives me more confidence in my trade, that's all. As an illustration, let's look at the last two months - February and March - and highlight where these tendencies were correct and where they weren't:
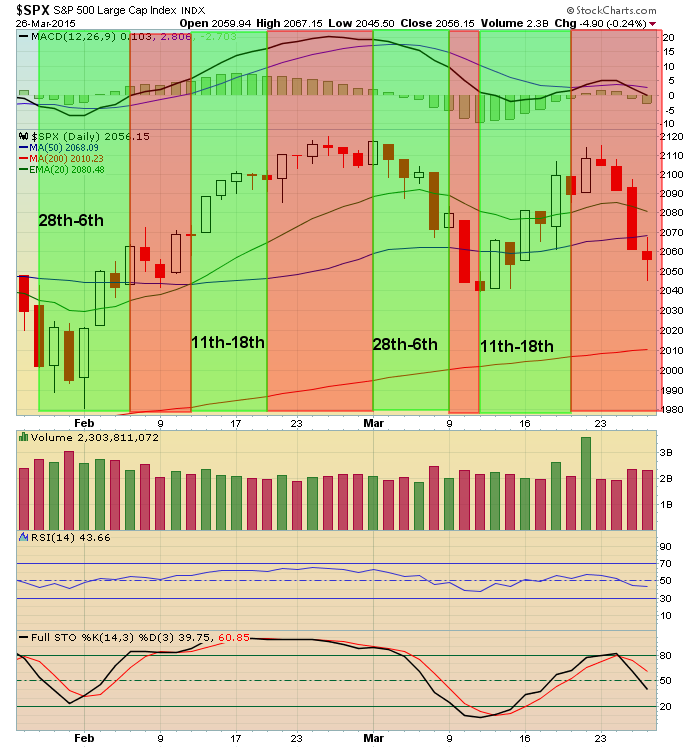
The green rectangles represent the bullish historical periods of the calendar month while the red rectangles represent the bearish historical periods. Note that they don't all work and you shouldn't expect them to. Three of the four bullish periods did work, while two of the four bearish periods worked with one of the other two basically flat.
Please do two things for me. First, click on the "Email updates" link to the right of my article and provide your e-mail address. Then simply click "Subscribe" and you'll begin to receive my articles via e-mail the second they're posted to my blog. Next, join me at noon eastern today for my webinar, "Trading Places LIVE! with Tom Bowley". I'm planning to discuss these historical trends in much more detail, breaking them down by decade to illustrate that this skewed performance isn't just a recent development. It's been a part of our stock market history every decade since 1950. You can CLICK HERE to register for today's event. I hope to see you there, but if you can't make it, be sure to check out the recorded video which will be posted shortly after the webinar ends.
Happy trading!
Tom
