I'm not ready to give up on this bull market. While anything is certainly possible, traders are not positioning themselves for a steep market decline. Perhaps we'll see a bit of selling, maybe even a correction, but the longer-term bull market still remains intact in my opinion. A key ratio to watch is how the consumer discretionary (XLY) sector stacks up against its consumer staples (XLP) counterpart. A rising ratio of the XLY:XLP signals a "risk on" market environment, conducive to higher equity prices. A falling ratio suggests "risk off" and fresh market highs with an accompanying falling XLY:XLP ratio can spell trouble just as it did just before the 2007 market top. I wrote about this last week, but it's worth a second look. Check this out:
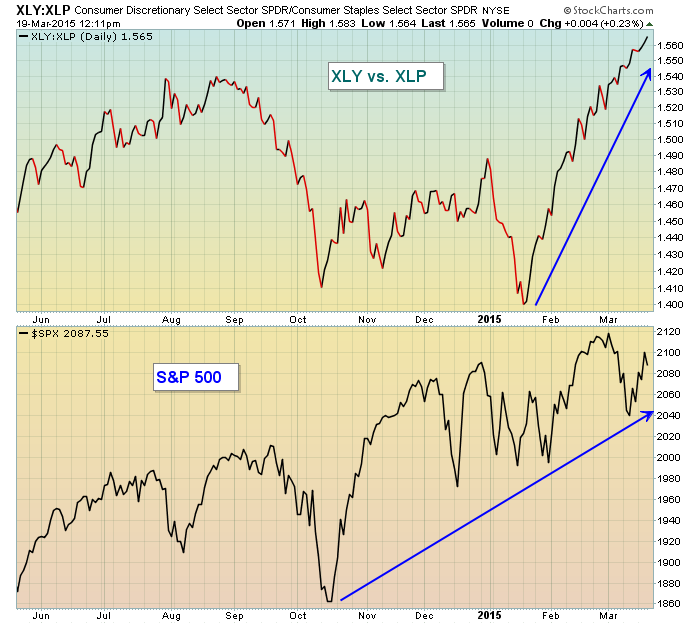
You might look at the above, see the XLY:XLP low in January and think negatively about the market. I'd caution against that. In fact, check out my previous article on home construction ($DJUSHB) and you'll find a longer-term look at the XLY:XLP and that showed the 1.40 relative low in January to be a retest of a prior relative breakout. The pattern on this relative chart at that time was quite bullish (wedge) which proved to be predictive in nature as relative support held. Since that 1.40 relative low, money has rotated to consumer discretionary in a very powerful way and that's bullish for equities.
Now let's update the DJUSHB chart. If you recall, we had broken out of a long-term ascending triangle pattern at 550. The measurement on this breakout was 710 and we're heading in that direction. The recent low was a perfect back test of the 550 breakout and the DJUSHB quickly surged higher from there to challenge its recent high. Fed meetings have proven to be quite bullish for the DJUSHB in the past and this week has been no different. Here's an update on the DJUSHB chart that was provided last week:
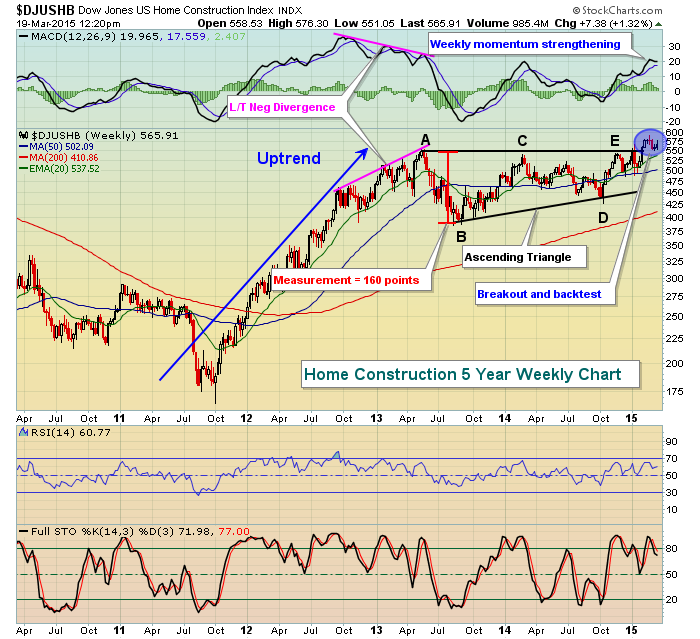
Thus far, home construction has held its key breakout level at 550 (and its rising 20 week EMA at 538) and further supports the notion that equities are looking to move higher.
Now that we've recapped a couple areas discussed last week, let's move on to the Dow Jones Transportation Average ($TRAN) vs. the Dow Jones Utility Average ($UTIL). Another gauge of traders' appetite for risk is the relative strength of transportation stocks, which perform well in a strengthening economy, versus utility stocks, which perform better in a weakening economy or more defensive market. Here's the chart:
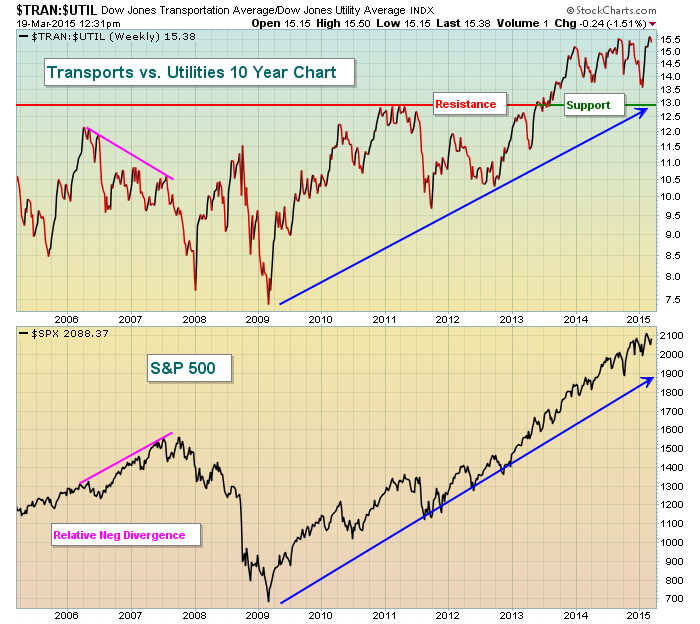
It's important to note a couple things here. First, the 2007 all-time high on the S&P 500 was accompanied by a declining TRAN:UTIL ratio. So while "on the surface" the S&P 500 looked great, "under the surface", we were beginning to see deterioration. This further confirmed what we saw on the XLY:XLP chart in 2007, which also was declining. Rotation towards defensive-oriented stocks in a rising equity market is a WARNING sign. Nothing is ever a guarantee, but you should become more defensive and protect profits as warning signs mount. Second, if we fast forward to the past six years of this current bull market, you'll see the ratio continues to power ahead to fresh new highs. Again, it's very difficult for me to grow overly bearish when money continues to support aggressive areas of the market. Could we see a pullback? Of course, but just be careful about growing too defensive.
Tomorrow, I'll move my focus to technology stocks where a couple of key industry groups are showing very bullish patterns as they await their turn for breakout. Please make sure you click on the "E-Mail updates" link to the right of my article. Enter your e-mail address and hit "Subscribe" and you'll automatically be sent my articles as soon as I post them!
Happy trading!
Tom
