Let's continue the discussion from yesterday. Broadcom (BRCM) had fallen back in late January to test both price and multiple gap supports, with an intraday move beneath both that suggested we could be witnessing a breakdown. By the close, however, BRCM printed a very bullish reversing candlestick (hammer) at that major support level and did so on very heavy volume. Having the patience to see how BRCM would close that day would have been much easier if your entry had been close to support as your intraday percentage losses would have been minor. But if your entry had coincided with a prior high after a rally, holding on through the intraday breakdown would have been a much more emotional task. Simply put, emotional trading is what we want to avoid. Greed and panicked trading are killers. As a refresher, this is the BRCM chart I left you to ponder yesterday:
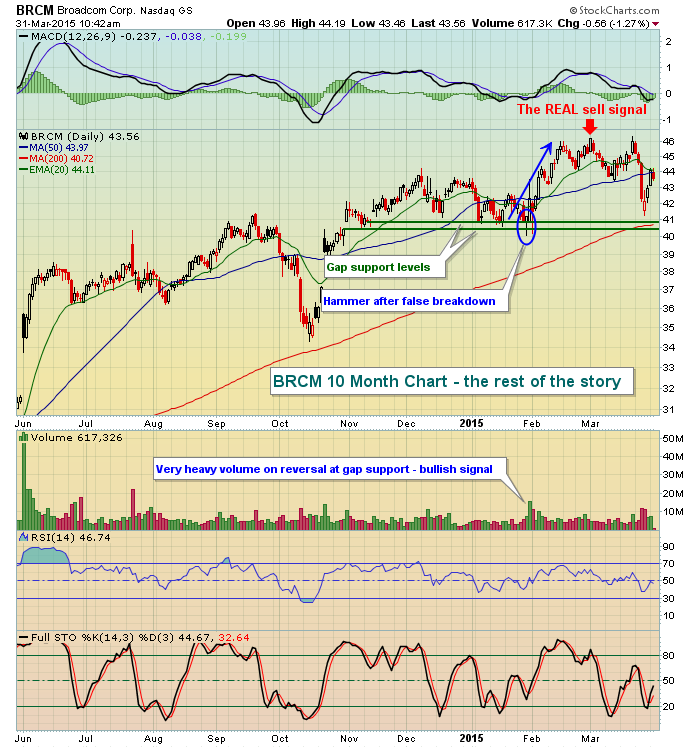
There were some excellent responses in the Comments section yesterday, most of which were right on target. For me, the breakout occurred without conviction. In trading terms, there simply wasn't any volume to confirm the breakout. Many of you correctly pointed out that the momentum oscillators were also printing lower highs as prices were moving to fresh highs. By definition, this is a long-term negative divergence, which is indicative of slowing momentum. One word of caution here though. Often times, a breakout occurs with a negative divergence appearing. My view is that a high volume breakout trumps the negative divergence. There is no better technical indication in my view than the combination of price and volume. That is clear cut and there isn't a whole lot of room for interpretation. A high volume breakout means potential accumulation, or more buyers than sellers. And if that continues the price goes higher. End of story. So looking at what the MACD (comparison of 2 EMAs) is doing doesn't matter as much. I pay attention to it, but my #1 indicator - price/volume - is screaming at me to buy and I won't ignore that.
Let me give you an example of how the MACD can be misleading at times and how you can trade off it prematurely. Baidu (BIDU) broke out last July in very similar fashion to the BRCM breakout I discussed above. We were in a confirmed uptrend and had just bounced off rising 20 day EMA support. The breakout occurred with the new close clearly above prior closes. Higher prices and lower MACDs - that's a clear negative divergence, correct? Then why would you make a different trading decision on BIDU? BRCM was a sell when this occurred, but BIDU is a buy? First, let's check out the BIDU chart as of July 21, 2014 just as it made the breakout:

It looks very similar to BRCM, right? Well, except for one VERY obvious difference. Check out the volume. On BIDU, the volume exploded on the breakout, which is an indication that the breakout is confirmed. It's also a sign that market makers could be on the long side of the breakout as well. At this point, I'd grow more concerned if one of two things occurred - either (1) a high volume reversing candle gave us confirmation of a potential top, or (2) we lose the breakout level (now support) with that negative divergence in place. In other words, on this breakout I'd raise my closing stop to the 191-192 area. But I wouldn't sell because I'm getting the volume confirmation. Remember, that price/volume combination is my #1 indicator. I use the MACD as a "secondary" indicator, not a primary one. If price breakout occurs with solid volume and the MACD is moving up alongside, it confirms my long strategy. If price breakout occurs with solid volume and the MACD is lower (as it is with BIDU in this example), I'm still fine with the long position, but I'm going to be more cautious (ie, raised stop to that 191-192 level).
In this example, the high volume proved to be the key indication, not the negative divergence on the MACD. Check out the rest of the action on BIDU subsequent to the high volume breakout:
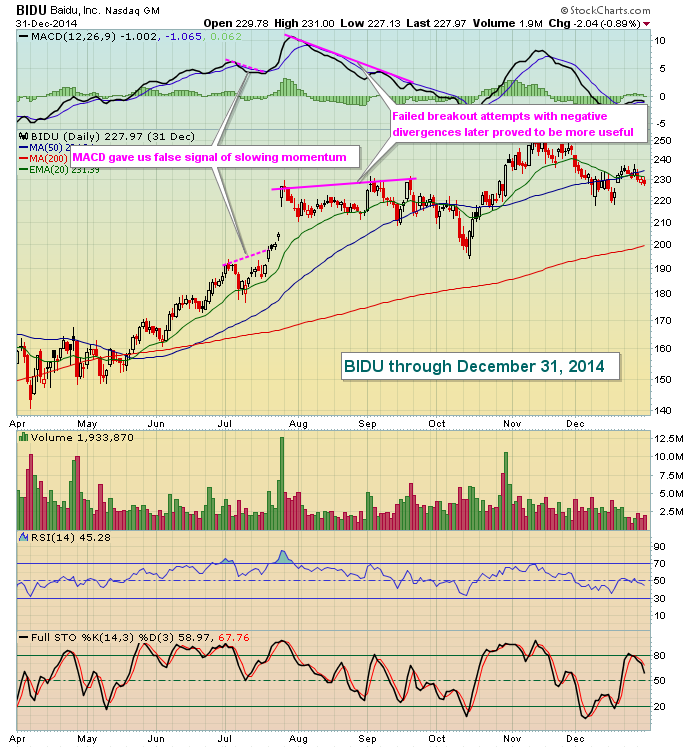
BIDU screamed higher on that breakout, rising another 15% within a week. That was the best move of 2014 on BIDU. The negative divergence on July 21st gave us a false, and very costly, signal. Note that the next breakouts in September were not sustained as there was limited follow through. That led to more negative action over the next month as BIDU moved lower to "reset" its MACD back to its centerline.
One of my experiences in using the MACD in my trading arsenal is that you cannot really judge the momentum solely by using the MACD blindly. It should be used in concert with the combination of price/volume. At the first signs of a breakout with volume, there's no telling how far the rally might go. From a common sense perspective, it's difficult to conclude that momentum is slowing when a stock makes a fresh high on solid volume. So just be careful not to jump the gun and be premature with your sell call by using the MACD exclusively. Use it as a "secondary" indicator in conjunction with price/volume and I believe you'll see better results.
Now let's flip back to BRCM and that first chart above. While the argument for slowing momentum based on the MACD negative divergence is a compelling one, and by definition of a negative divergence a correct one, it was really more about the lack of volume that suggested to sell in my opinion. I'm always leery of a low volume breakout because it gives me little comfort that market makers are supporting the move to the upside. And if they're not buying, I head for the exit no questions asked.
Thank you for your comments and feel free to leave additional comments below.
I'll continue this series of sell strategies tomorrow. In the meantime....
Happy trading!
Tom
