Gaps are strange creatures and knowing what to do after one is difficult because emotion does crazy things to our patience and discipline. Gaps 101 tells us that most gaps fill. What does that mean? Well, if ABC company closed yesterday at 10.00 and opened today at 11.00, "filling the gap" would occur when ABC fell back to 10.00. Based on that analysis alone, buying ABC at 11.00 can be a poor emotional decision as the gap fill would represent a much better "reward to risk" entry. But what if it doesn't fill? That's the thought that goes through our minds and a thought that quite honestly we need to ignore. For me, it's not about THE GAP. It's about WHY did it gap and what happens AFTER the gap? Let me start with the former.
I love trading gaps that occur with earnings. Earnings reports can be game changers for companies. Wall Street is quite stubborn at times, with the crowd believing one thing or another about a company and then BAMMMM the game changer occurs and we see a major trend reversal. Spotting such a reversal can prove to be financially rewarding as I'll illustrate with VASCO Data Security (VDSI). This next chart doesn't show us much detail, but I'm not interested in the detail at this point. What you need to focus on is the heavy volume that accompanies the downtrend line break. This occurred with a positive earnings report and an explosive jump in stock price. Simply check out the reversal in fortune first and we'll look at more detail in a minute:
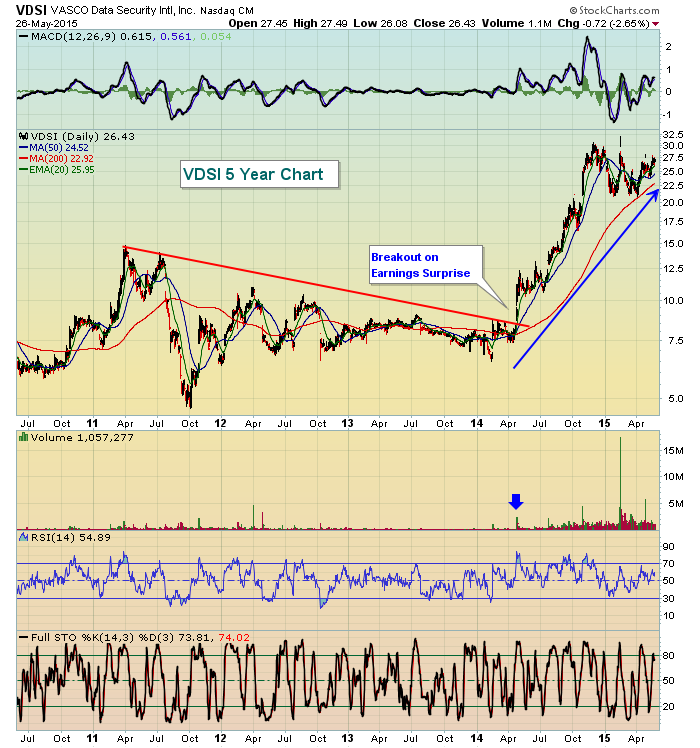
Note a few things here. First, VDSI was languishing in a 3 year downtrend during which it lost more than half its market capitalization - all while the overall stock market remained in a lengthy bull market. That's the definition of frustrating and the stock market was convinced VDSI had little upside. But the earnings report delivered in the second quarter of 2014 completely changed the outlook of the company. You might think that lots of companies beat Wall Street expectations and are in downtrends so what separates VDSI? Well, we never know for sure and that's why we always keep our stops in place - to limit our downside. But the primary keys for me are (1) a bullish technical development (in this case, a big gap up and break of downtrend line resistance) and (2) VOLUME. Why is volume so important? Well, it's difficult for accumulation to take place without it. We want to be in stocks that are showing signs of accumulation and that takes me to my earlier point of what happens AFTER the gap. For that, let's look at the daily chart from the first six months of 2014:
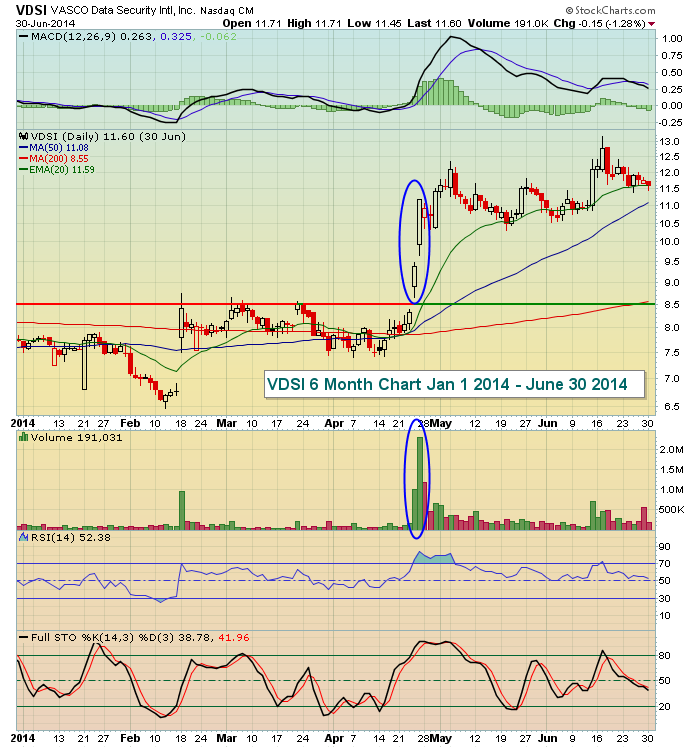
When stocks gap higher, it's an indication of an imbalance between supply and demand. Obviously, buyers are swamping sellers on the positive earnings surprise. Market makers are liquidity providers. During periods of order imbalances, they take the other side of the trade - in this case, they're shorting. Because market makers rarely lose money, many stocks will "fill the gap" after gaps higher (or lower), which provides them profit if they trade on the short side after a gap higher. In this case, however, VDSI kept climbing on extremely heavy volume and that's a clear sign that accumulation is taking place. Those hollow candles mean that VDSI was closing near its high of the day. In other words, there wasn't just an imbalance of demand at the open that later subsided. The demand continued throughout the day with buyers swarming right up until the closing bell. This is the type of company I want to own. It simply becomes a case of where do I buy while maintaining a superior reward to risk. The gap here is referred to as a breakaway gap where the gap changes a prior trend and occurs on massive volume. These tend to be very powerful bullish signals and buying during a pullback or consolidation makes solid technical sense.
VDSI later had a continuation gap, also as a result of a positive earnings surprise, and three excellent reward to risk entries later appeared. Let's look at those:
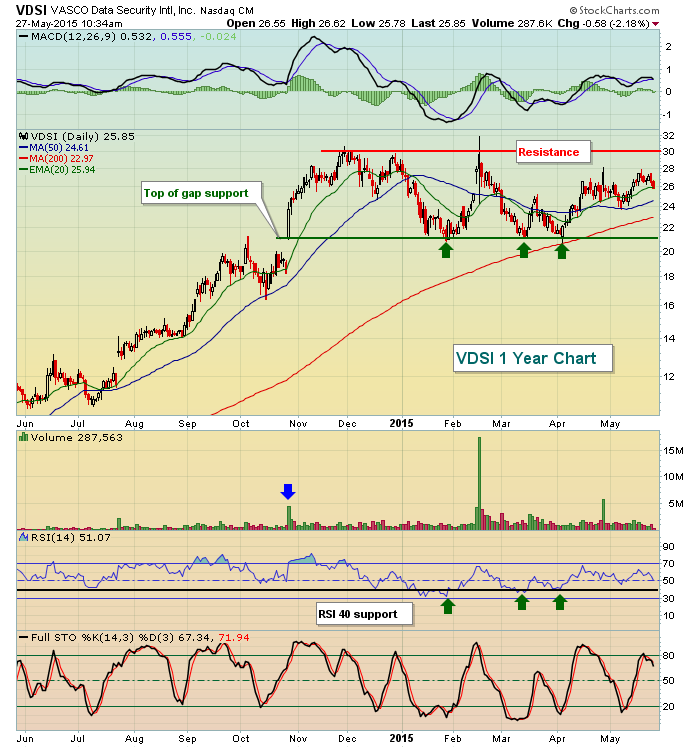
First, note this is a continuation gap in October as there is a prior uptrend in place. We're now in the midst of a bullish bull flag with price resistance near 30.00 and the top of gap support marking support near 21.00. We've seen three successful tests of gap support, which suggests this to be an excellent area to consider entry.
We've essentially wrapped up the majority of earnings season and in my upcoming webinars I plan to focus more on gaps that have been created by strong earnings reports. So if you can, please plan to join me this afternoon. CLICK HERE for easy registration. Best of all, it's FREE! And don't forget to subscribe to my blog to the right of my article!
Happy trading!
Tom
