 Just like with fundamental analysis, technical analysis has two sides - those who look at the glass as half full and those who view it as half empty. The current technical state of the Dow Jones U.S. Specialty Consumer Services index ($DJUSCS) is certainly up for debate. There are several positives, but just as many negatives so you make your best argument and let the chips fall where they may. I'm going to take the bullish view here. First of all, we're in a raging six year bull market. That makes it difficult to be pessimistic. The DJUSCS is part of the consumer discretionary space and this sector has been a leader throughout the bull market. That helps. From one look at a longer-term chart of the DJUSCS, I see a nice uptrend channel that remains intact. Weekly RSI is near 50 so overbought conditions are not a concern. We've been sideways consolidating since the fourth quarter of 2014. I could even argue that this "base" has formed over the past two years with Tuesday's close of 1028.71 nearly equal to the closes we saw towards the end of February 2014 - and not much higher than where we were when we nearly reached 990 in July 2013. By comparison, the S&P 500 is up approximately 20% since early July 2013.
............sigh.
Okay, so given this relative underperformance, why am I optimistic?
Well let's take a look at the weekly chart of the DJUSCS that dates back seven years to capture the essence of the current bull market:
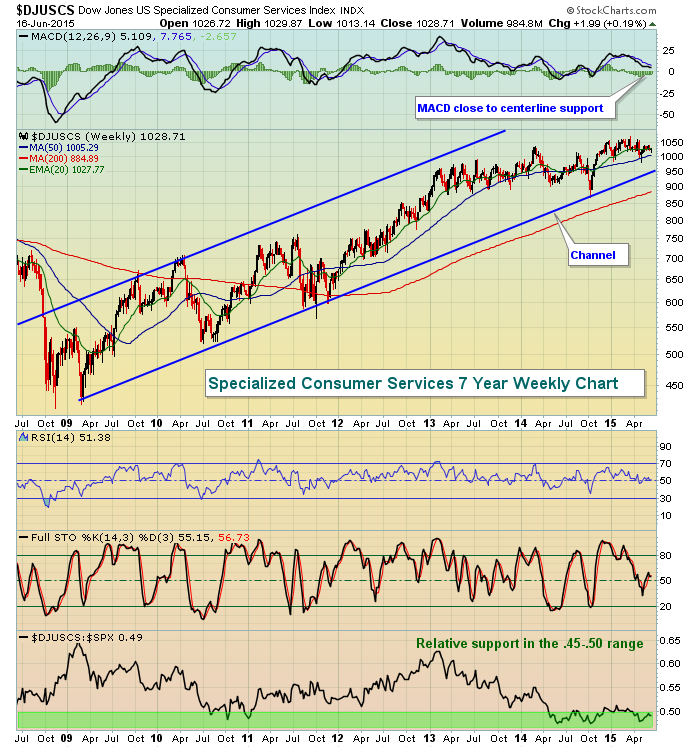
2012 was a very strong year, evidenced not only by the roughly 40% gain in this index that year, but it's also illustrated by the jump in its relative strength vs. the S&P 500 throughout 2012. That was a nice time to be long stocks in this group. But since 2012, the relative strength has tumbled despite the DJUSCS remaining in that nice uptrend channel. But notice a couple things. First, as we began 2013, this index was very close to its upper channel line. After two years of consolidation or "basing", the index is now much closer to its lower channel line. Until this industry group loses its lower channel support, I'd assume it will continue. Also note that its relative strength has stabilized over the past year very close to where its relative strength bottomed in 2010, just before two years of relative outperformance. Based on this, I believe it's time to consider individual stocks in this space.
Here are four stocks in the DJUSCS that look interesting to me - all for different reasons, with a brief technical summary after each:
1. MercadoLibre (MELI):
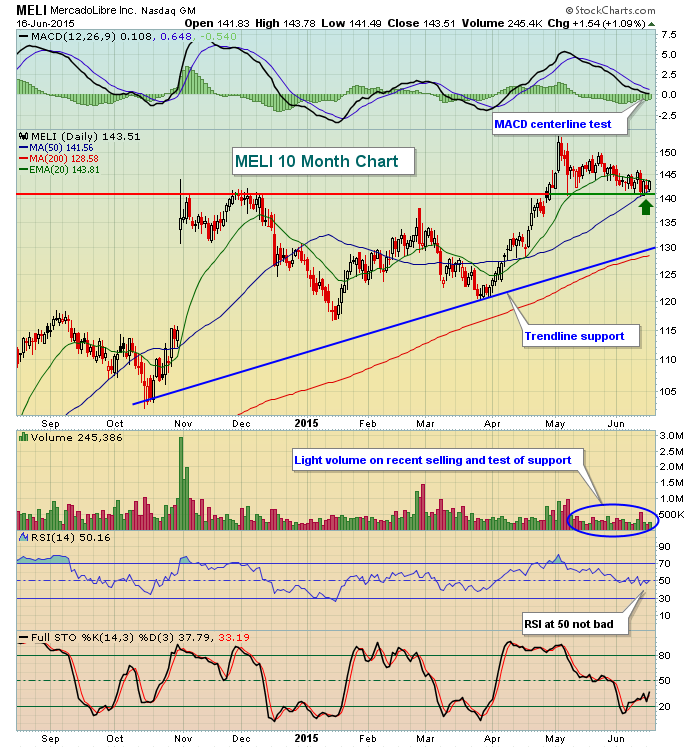
The last five weeks or so haven't been kind to MELI, but note this selling comes on the heels of overbought conditions in early May and the volume has been super light. MELI is now testing both price support and its rising 50 day SMA. While I'm expecting a reversal at the current level, failure to do so could result in another test of its rising trendline, formed off October and March lows.
2. Stamps.com (STMP):
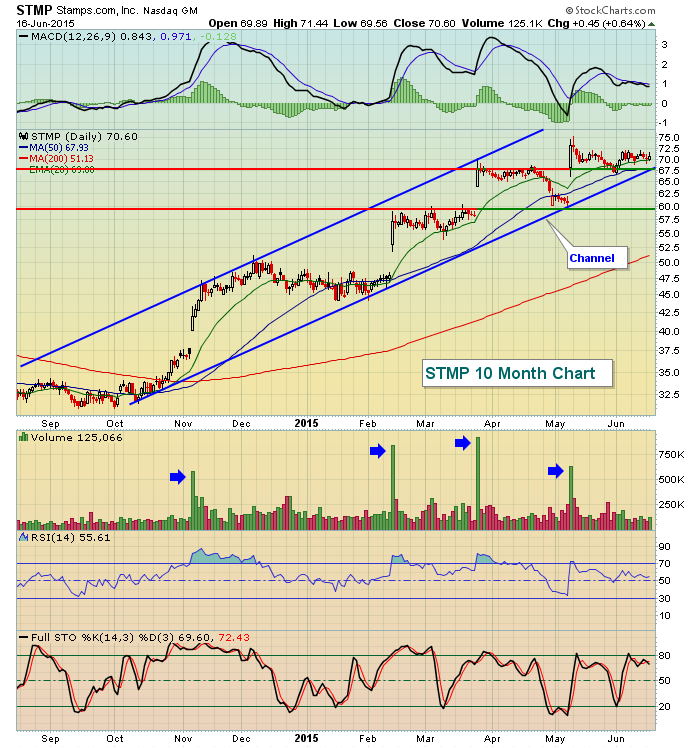
It's difficult to ignore the large gaps higher on massive volume over the past 6-7 months. I didn't go back to confirm, but I would imagine these surges in price relate to strong quarterly earnings results. The momentum here has been outstanding, but the consolidation the past 5-6 weeks has left STMP close to its lower channel line, a nice reward to risk entry point. Perhaps the biggest risk here is that expectations are now high for STMP so a disappointment with respect to earnings could result in a significant gap lower. I'd still expect to see higher prices given the chart, rather than lower.
3. ServiceMaster (SERV):
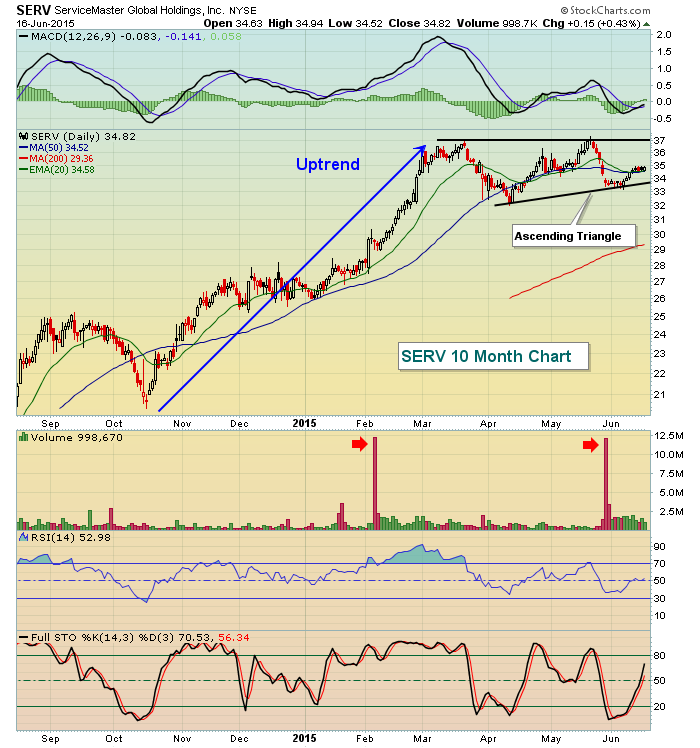
The bullish pattern here is obvious to me. There's a very clear uptrend in place with serious overbought conditions that developed in February and March. Since that time, SERV consolidated in an ascending triangle as overbought conditions vanished. What's not to like? Well, those two large red volume bars made me do a little research. In both February and May, SERV had secondary public offerings of 20 million or more shares. None of the proceeds of these sales went to the company. Instead, they resulted from stockholders wanting to exit positions and were sold primarily to institutions via these secondary offerings. Despite the large volume associated with these offerings, price support levels were never violated so I remain optimistic technically. In April, SERV did report better than expected earnings and, outside of those two secondary offering days, volume has actually been more supportive on up days. This pattern, if confirmed by a breakout above 37.00, measures to 42.00 in time. A break below 33.00 and especially 32.00 would negate this ascending triangle pattern.
4. RetailMeNot (SALE):
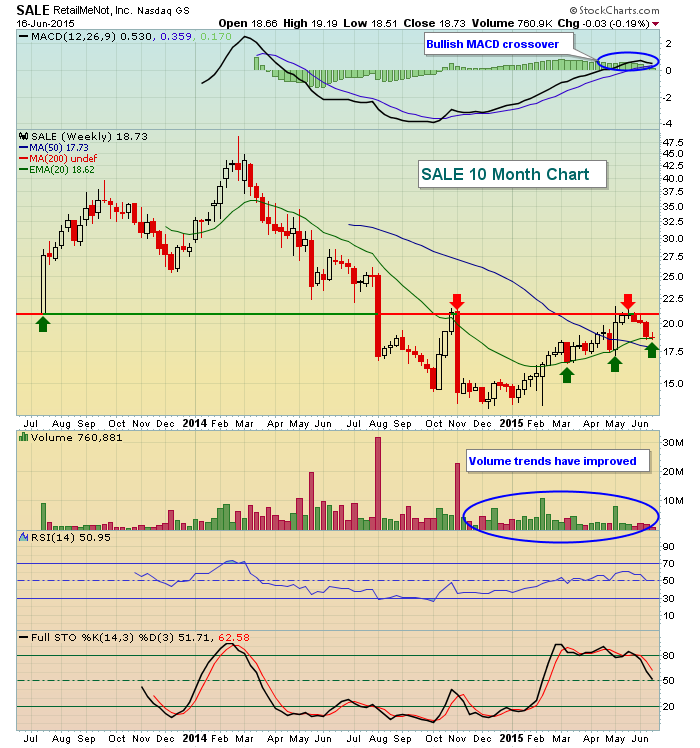
SALE is a bit more of an aggressive trade because it still has much to prove technically. I do like the improved volume trends and the fact that weakness continues to be contained above the rising 20 week EMA. This 20 week EMA also has crossed over the 50 week SMA and there's been a bullish MACD crossover as well. Those are the bullish points. The primary negative at this point - and it's a biggie - is that 21.00-21.50 seems to represent very significant price resistance dating back to its IPO in July 2013. A break above this range on solid volume would be a major bullish development so SALE is worth watching. The test of the rising 20 week EMA could even represent solid initial entry for those who are a bit more aggressive.
During my webinar at noon EST today, I'll take a look at this industry group and the four stocks above, along with my normal evaluation of sector and industry group strength/weakness. You can join me by REGISTERING HERE. Registration is simple and the webinar is FREE. Also, if you enjoy my articles, be sure to "Subscribe" at the upper right of this article by providing your email address. Once you've subscribed, all of my articles will be sent to the email address you provide immediately upon publication.
Happy trading!
Tom
