The Strategy
Tuesday marked the end of the second quarter. During the 2015 "halftime report", I thought I'd take a moment to share my approach to individual stock trades. Trading can be a daunting task, especially if you're looking at individual stocks because there are THOUSANDS to choose from. Of course, everyone knows about the Apple's (AAPL) and Facebook's (FB) of the world, and Lord knows I get plenty of questions about both, but how can you pick from the remaining thousands? Well, I take a very simplistic approach and it just makes perfect common sense to me. Nearly two years ago, prior to joining StockCharts.com, I created a trading service at EarningsBeats.com that combined the power of strong technical indicators with better than expected fundamental results. Namely, a company had to beat top line (revenue) Wall Street estimates and bottom line (EPS) Wall Street estimates just for me to CONSIDER putting it on a ChartList here at StockCharts.com. I'll describe the process I go through below:
Key Elements of The Strategy
(1) Do your homework
The first step is to find companies that are beating top and bottom line Wall Street estimates. That information is available at Zacks and I'll show everyone in my Trading Places LIVE webinar at noon EST today how to access the information easily. (You can REGISTER HERE for the webinar - it's FREE). This alone doesn't guarantee that the stock price is heading higher. It's quite possible that a company made a pre-earnings move higher in terms of its stock price in anticipation of the strong results and it's already fully valued. Furthermore, the Zacks information I use doesn't tell me whether they lowered expectations in the quarter(s) ahead. So Step 1 is really about finding the stocks that beat on both top and bottom lines and then performing additional steps to determine whether it's a stock I want to put on a Watch List. I would guess that maybe 15-20% of the stocks that beat Wall Street estimates actually find a home on my Watch List.
(2) Liquidity Evaluation
My next step is to simply look at a chart and specifically look at the daily volume bars. Does the stock trade enough shares on a daily basis to warrant consideration? I generally use roughly 200,000-250,000 average daily trading volume as a benchmark, but keep in mind that I was running a trading service for a large number of traders. If you're doing this for yourself, perhaps you'd be comfortable with fewer shares being traded - maybe 100,000? That's a personal call and completely up to you.
(3) Technical Evaluation
Okay, this one is quite subjective. Technicians view charts differently. Otherwise, everyone would always be on the same side of a trade. What's bullish to me may not be bullish to another. My favorite chart pattern is where a company's price has been basing/consolidating for months and upon its better than expected earnings results, gaps higher and above resistance in that previous sideways consolidation pattern. I also prefer to see a hollow candle that day on massive volume, which tells me that market makers could not slow the demand for the stock throughout the trading day. A hollow candle features a closing price that's above its opening price. It's a significant sign of accumulation in my view, a necessary component of a stock that normally moves higher. The hollow candle is not a prerequisite for entering a trade, however. The key component is simply breaking out with strong fundamental results on heavy volume. Visualizing this breakout might prove helpful so here is a chart of Tableau Software (DATA) to drive home my point:
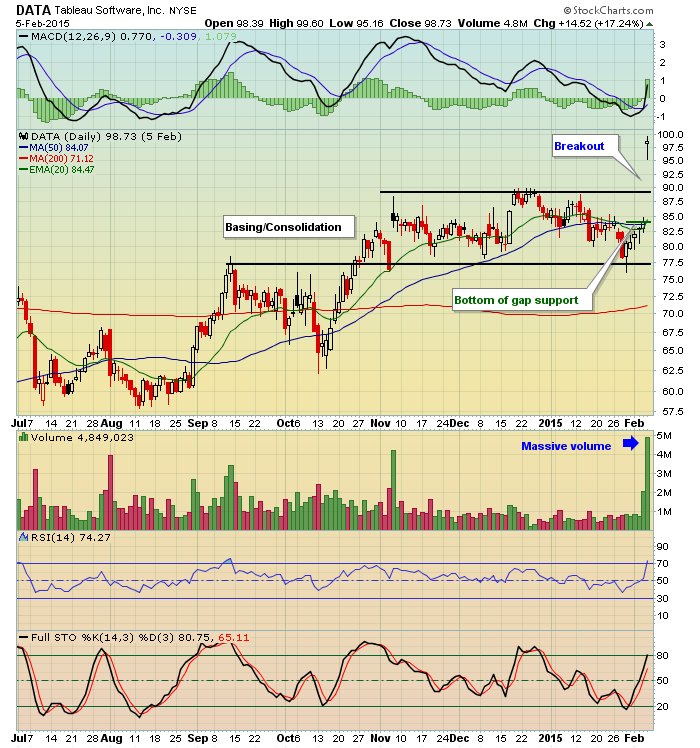
This was DATA's chart as of February 5, 2015, the day after it reported revenues and EPS that topped Wall Street consensus estimates. It marked the day I added DATA to my Watch List. Notice a few things on this chart:
(1) Volume screamed higher in support of the price breakout.
(2) The RSI quickly jumped into overbought territory above 70.
(3) DATA closed almost exactly where it opened.
That last point, closing near the open, impacts my entry strategy. Many times, when a stock gaps higher and continues moving up throughout the trading day and finishes with a large hollow candlestick, it suggests that the demand is very powerful and any selling down to the TOP of gap support is generally a solid entry. When I see a doji like this print, however, I assume I'll have an opportunity to enter the stock after a period of selling down to price support, the rising 20 day EMA or the BOTTOM of gap support - or possibly all three. I'll then exercise tons of patience and simply watch DATA for days or weeks, waiting for a better REWARD to RISK entry point.
Let's talk about reward to risk and what that means. The breakout of this sideways consolidation pattern measures roughly 12 dollars from the breakout point, the range of the basing/consolidation from 89 down to 77. That means my initial target would be roughly 101. If I use price support as a stop at 89, buying DATA at the closing price on February 5 at 98.73 would mean I have a RISK of more than 9 bucks (98.73 minus 89.00) while a trip to my target of 101 would yield me a return of just 2.27. So do you want to risk 9.73 to make 2.27? Please tell me NO. However, if we keep DATA on a Watch List and wait for a trip down to price support as an initial entry, the reward to risk scenario completely changes in your favor. Take a look at the subsequent action in DATA:
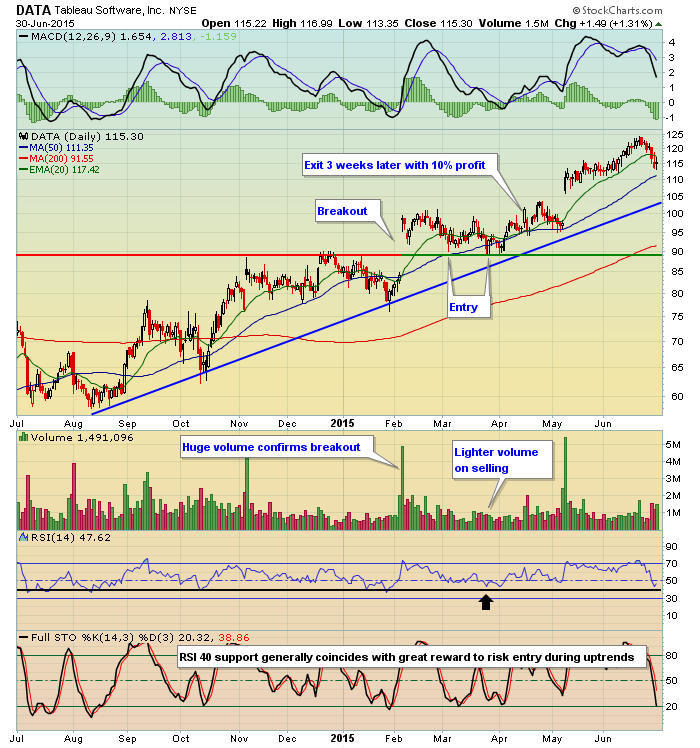
Patience provided a huge return in this case. Trust me, not every trade works out this well, but you MUST consider entering stocks when your risk is less and your potential return is more. As DATA pulled back to the 89-90 level, note that volume slowed and that the RSI dipped back into the 40s. Typically, my best trades occur when I buy uptrending stocks with RSIs between 40-50. Waiting on pullbacks enables you to enter a stock with less risk. Please note it does NOT guarantee a winning trade. We're simply trying to manage risk.
DATA was just one stock on a Watch List that contained probably 125-150 stocks at the time. The idea is to keep your Watch List loaded with stocks like DATA so that when rotation grips the stock market, you're primed to capture companies when they're ON SALE just as DATA was here. In this particular trade, I actually entered a one half position of DATA, holding off a second entry to see if the bottom of gap support near 84 would be tested. It never was.
Managing risk and putting the odds in your favor is a necessary part of any successful trading strategy. I am going to spend a lot of time during today's webinar to talk about implementing this trading strategy in detail, including how to find these companies at Zacks and then how to build a ChartList here at StockCharts.com to track this Watch List. Perhaps the most powerful feature of this trading strategy is to run scans at StockCharts.com against this ChartList on a regular basis. My favorite scan is to list all companies in my Watch List that have RSIs between 40-45. That narrows my Watch List of say 150 companies down to a very manageable list.
Please understand you must be a member of StockCharts.com to create a ChartList, but in my opinion, it'll be the best investment of your investing life as I'll show you during the webinar.
While I'd strongly encourage attendance at my webinar (or a viewing of the recording at a later time if you're unavailable today at noon EST), I've convinced my former partner John Hopkins to release EarningsBeats.com's trading results for 2015, which are really quite staggering if you consider that the S&P 500 is up approximately 0.25% for 2015 thus far. They provide their members complete access to their Watch List at any time so be sure to check this out when you get a chance. You can CLICK HERE to check out EB.com's amazing 2015 results and by joining with their special offer you'll have access to their entire current Watch List. If this strategy interests you, I think you'll enjoy the service. (Of course I'm biased because I created it.) :-)
I hope you can join me later today in my webinar. Even if you have a different approach to trading or investing, I think you'll find tidbits of information helpful in your daily routine. Again, you'll find the REGISTRATION form here.
Also, please don't forget that you can subscribe to my blog or any of the blogs here at StockCharts.com by simply looking to the top right of the article and finding "Subscribe to this blog". Click on "Email updates", type in your email address and hit "Subscribe". All articles will be sent directly to your email at the time the article is published so that you don't miss a single post. I speak for all of the bloggers here in saying that we really appreciate your support! Be sure to leave comments and suggestions as well!
Happy trading!
Tom
