Market Recap for Tuesday, September 29, 2015
We once again saw a bifurcated market - one in which both the Dow Jones and S&P 500 finished in positive territory while both the NASDAQ and Russell 2000 fell. That relative weakness in our more aggressive indices is not a good sign as it appears there's a rotation taking place where money is flowing into more conservative areas of the market. Utilities and consumer staples are the best performing sectors over the past three months now. Deterioration in the performance of consumer discretionary stocks vs. consumer staples is highlighted below in the Sector/Industry Watch section of this article. That too is worrisome, although we haven't seen a relative breakdown yet.
One positive is that late day buying sent the VIX moving lower into the close. Still it finished above 25 for a second consecutive day and that hadn't happened since early September. Therefore, realize that fear is ramping up and that leads to extreme volatility and wild swings like we're seeing this morning with futures. Be careful.
On Tuesday, the primary laggard was technology and the primary culprit was Apple (AAPL) as it now has lost recent trendline support on increasing volume. Take a look:
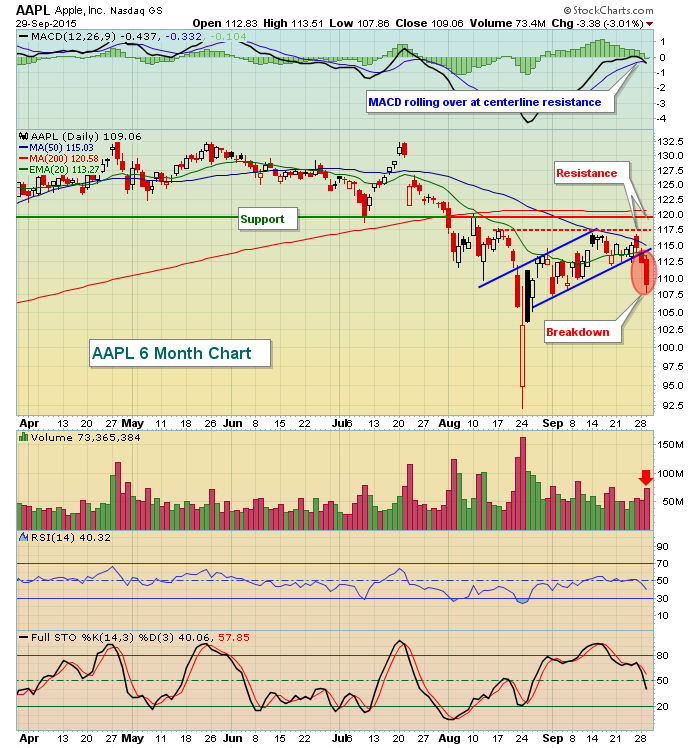
AAPL could rally back to that 112-115 area near-term, but it's broken technically for now so I'd need to see it clear the declining 20 day EMA on a closing basis before growing any more optimistic. Adding further pressure to the computer hardware index on Tuesday was 3D Systems Corp (DDD), which broke down below August lows on increasing volume. While a quick oversold rally can't be ruled out here either, I'd look for lower prices ahead based on the current technical picture.
Pre-Market Action
U.S. futures are soaring this morning as European markets are rebounding sharply. Based on where futures currently stand, the S&P 500 is poised to open back above 1900 and test the 1900-1910 near-term resistance zone provided in the S&P 500 60 minute chart provided under the Current Outlook section. Meanwhile, the London FTSE, French CAC and German DAX are all trading with gains of more than 2%. Of particular note, the German DAX ($DAX) is attempting to clear the level of its most recent price breakdown at 9648. The reaction high since that breakdown occurred was 9746 and then there's falling 20 day EMA resistance at 9918. If the U.S. markets hope to set a bottom with the August low, it would be helpful to see the DAX clear these hurdles in the days and weeks ahead.
Costco (COST) disappointed on its revenues, but beat bottom line estimates and the stock is currently down by about 1% in pre-market trade. It's down despite futures that point to a NASDAQ opening gap up of perhaps 1.25%-1.50%. Clearly, traders are disappointed with the light revenues here. COST cited same stores that were down significantly in places outside the U.S. (where comparable store sales were higher by 2%). For instance, Canada same store sales fell by 10%, slowing company sales growth overall. The results in Canada were negatively impacted by gas deflation and foreign currency exchange.
The ADP employment report showed 200,000 new jobs vs. the 190,000 estimate (Bloomberg) and that has sent traders fleeing from treasuries this morning. The 10 year treasury yield ($TNX) rose back to the 2.09% level at last check, but the yield remains in a downtrend. If the yield falls back down to that 2.05% today, then the early stock market gains will likely evaporate as well. The more closely watched government employment report will be released on Friday morning at 8:30am EST and given Fed Chairman Yellen's somewhat conflicting and confusing statements of late, there'll probably be even more attention on the jobs report Friday. Speaking of the Fed Chair, she'll be providing a few remarks this afternoon in St. Louis beginning at 2pm. That could impact both bond and stock trading on an intraday basis as well.
Current Outlook
It would seem that current prices represent a level where we should see a bounce. The S&P 500 fell to a low of 1871.91 on Tuesday, just 4 points shy of its 1867.61 low close set on August 25th. That's quite close to a test of those important lows. It hasn't been pretty since the bearish wedge lost support a little over one week ago, but now we've essentially tested support. Here's the current technical state of the S&P 500:
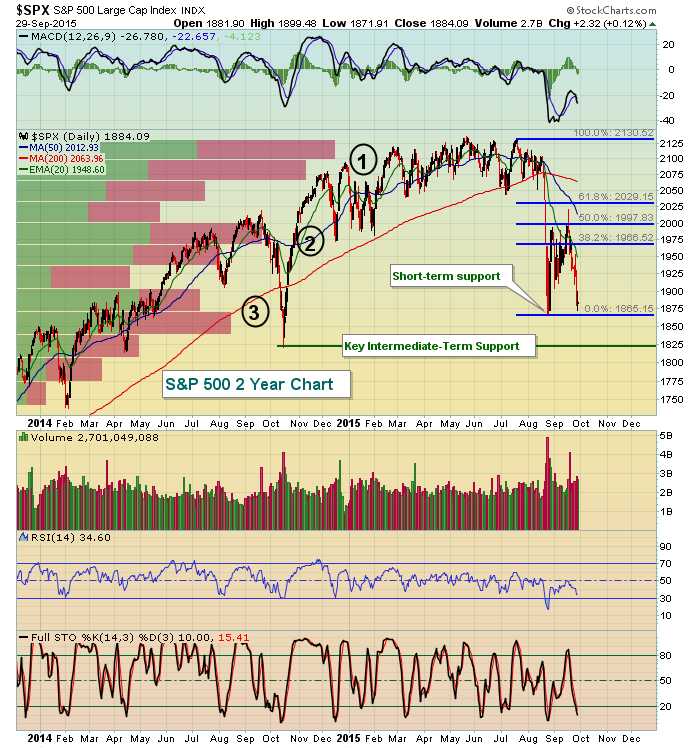
First, let's focus on the Fibonacci retracement levels. After the significant decline from July highs to August lows, we saw an intraday bounce on September 17th that approached the 61.8% retracement level before failing. The close that day was very near the 50% retracement level. These are both levels where we typically see countertrend moves dissipate. That was the case here as we've since moved back down to test short-term support at the August low. But if we step back a little further and look at the two year picture, I've included a "volume by price" overlay that shows high volume occurring in 3 trading ranges. The heaviest volume (Point 1) has occurred between 2075-2125 as price action stalled there for months during 2015. The next key area (Point 2) encompasses the 1950-2000 trading range, which is exactly where our last rally attempt failed. Finally, Point 3 shows us that the 1850-1900 zone has also reflected significant volume and this is the area where we're currently residing. Note that the critical October 2014 low basically falls in this current range as well.
It's important to hold the October low. If we don't, I believe we could revisit the double top breakout near 1550-1600 as shown below:
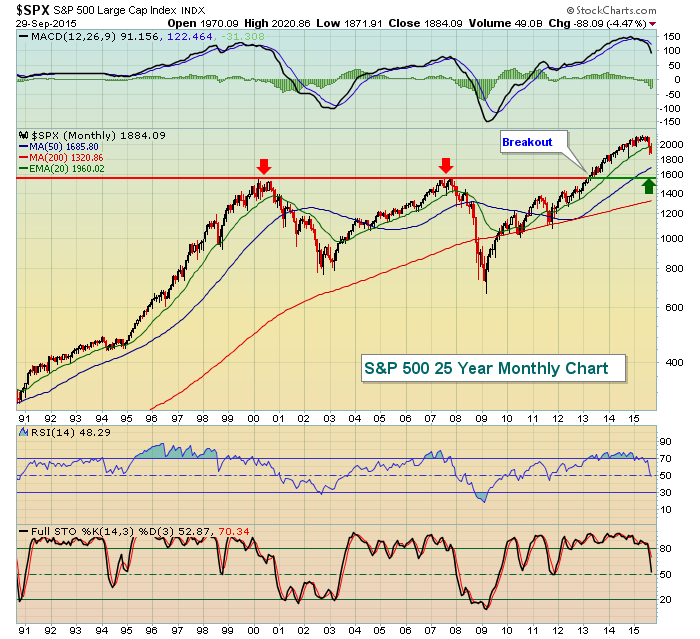
We've fallen beneath the rising 20 month EMA for the first time since 2011 and that last loss of EMA support resulted in a trip to test the rising 50 month SMA. Currently, our 50 month SMA resides at 1685.
The last two charts provided the daily and monthly views. Given this background and big picture view, let's look at the S&P 500's 60 minute chart to look for possible short-term reversing areas:
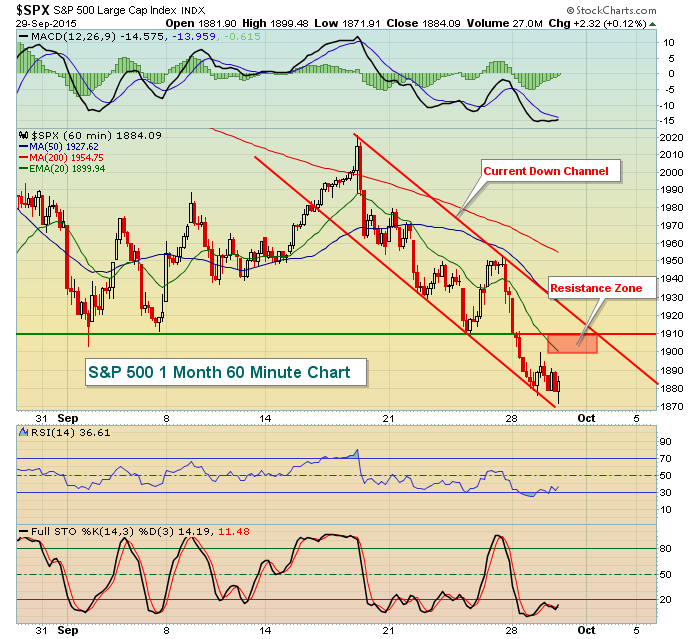
The red shaded rectangular box represents a confluence of resistance. This 1900-1910 area is home to 20 hour EMA, trendline and price resistance points. A breakout above all three would suggest the rally could last awhile longer - perhaps to test the falling 20 day EMA, currently at 1949. The best reward to risk setup on the long side would occur if the S&P 500 rallies to test the resistance zone identified, then falls back down one more time to test that 1867 August support. That action would almost surely produce a positive divergence on the 60 minute chart above as the MACD is currently stretched to the downside. Incoming money flows to start October would support a rally as well. Historically, the stock market performs quite well in the first week of a calendar month, although October isn't the best in terms of first week performance. In fact, the Russell 2000 historically performs horribly to begin the month of October. I'll provide more details about that in tomorrow's article under the Historical Tendencies section.
Sector/Industry Watch
I'm watching the relative performance of consumer stocks very closely. The relationship between consumer discretionary (aggressive) stocks and their consumer staples (defensive) counterparts is always worth noting. This ratio (XLY:XLP) normally moves higher to support a bull market and drops during a correction or bear market. It has stubbornly held onto relative support lately despite the market's overall weakness. On the following chart, however, you can see this ratio is on the verge of dropping to its lowest level since early 2015:
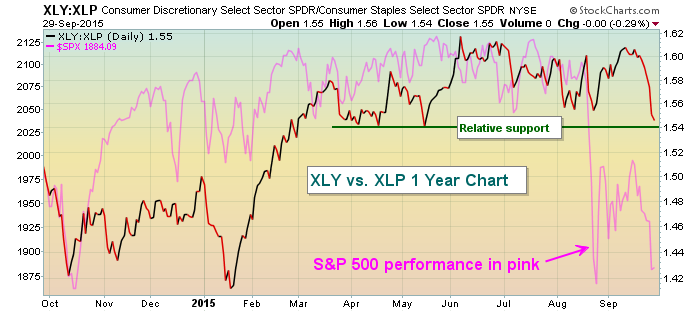
The tumble that U.S. equities took in August could have been much worse. Consumer discretionary (XLY) stocks held up relatively well. Yes, they fell like the overall market, but they didn't lead on the way down and that's one positive for the market currently. You can see that we closed near 1.54 on this ratio on Tuesday and a close below would be a signal of deteriorating conditions within the consumer space, not what the market needs right now.
Historical Tendencies
In Tuesday's article, "Russell 2000 First To Lose August Support", I used the Seasonality Tool here at StockCharts.com to illustrate the exceptional historical performance that airlines ($DJUSAR) enjoy during the month of October, rising 93% of Octobers over the past 16 years. Now I'm going to show you why airlines perform so well. It's crude oil ($WTIC) baby. Crude oil performs its weakest during the month of October on a historical basis and that provides the liftoff for airlines. Take a look at this seasonality chart:
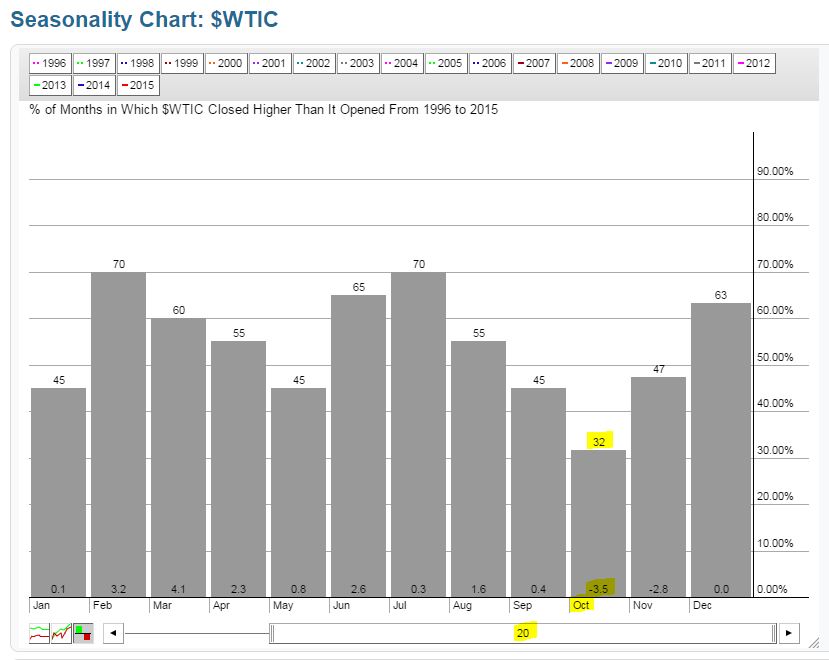
From the above you can see that crude oil prices have AVERAGED falling 3.5% during the month of October over the past 20 years and have risen only 32% of the time for the month. That's provided the (cheaper) fuel for airlines to take flight.
Key Earnings Reports
PAYX: (actual) vs. $.51 (estimate)
Key Economic Reports
September ADP employment report released at 8:15am EST: 200,000 (actual) vs. 190,000 (estimate)
September Chicago PMI to be released at 9:45am EST: 53.6 (estimate)
Fed Chairman Yellen provides opening remarks to the St. Louis Fed community banking conference at 2pm EST
Happy trading!
Tom
