Market Recap for Friday, September 25, 2015
Friday looked like two different markets. The Dow Jones gained 113 points, the S&P 500 finished flat and the NASDAQ and Russell 2000 both fell more than 1%. Talk about bifurcation. Crazy. But in the end, the problems remained across the board. Even with its strength on Friday, the Dow Jones is still well below its falling 20 day EMA and the Volatility index ($VIX) again moved higher to challenge resistance in the 24-25 area. A breakout in the VIX will likely have a detrimental impact on the direction of stock prices. Another case of the Monday blues won't help. The following illustrates the resistance area for the VIX. A breakout above this 24-25 resistance zone indicates an increased level of fear and that is the environment for BIG drops in the S&P 500. Check out the VIX chart:
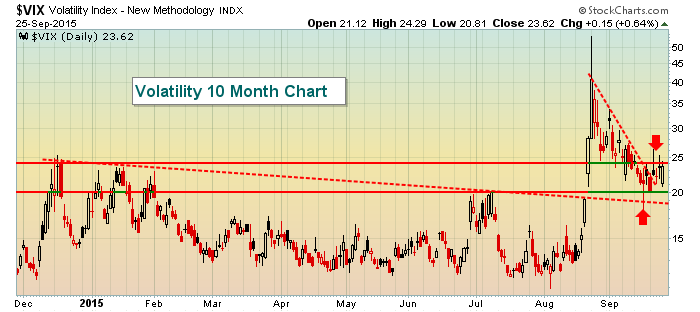
First, note that I don't include any indicators or overlays on the VIX chart. The VIX isn't priced like a stock. It's an indication of "expected volatility" ahead based on the pricing of near-term S&P options. When fear ramps up, the VIX spikes higher, then subsides. Momentum indicators like the MACD, RSI and stochastic don't help to provide us technical clues because the VIX generally doesn't trend - at least not higher - for long periods of time like individual stocks, ETFs, sectors or major indices. I'm only concerned about the price of the VIX and whether I'm seeing fear grow (breakouts). So looking at the above chart, you can see that fear was subsiding off that extreme in August. The red dotted line from late August through the middle of last week can help you visualize it. With the market's weakness last week, however, the VIX broke that downtrend and is now range bound from 20-25. A breakout above 25 would signal perhaps another bout of selling, bringing the August lows in the market into sight. Failure to hold the August lows would likely send the VIX surging back into the 30s, 40s or possibly higher. When the VIX is flying to the upside, it's not a great idea to become a super hero on the long side as losses can mount very quickly. Keep an eye on the VIX level this week.
Utilities, financials and consumer staples were able to finish in the green on Friday while the other six sectors were losers. Healthcare was the only big loser, dropping close to 3% as each of its industry groups fell at least 2%. Biotechs ($DJUSBT) were at the bottom of the heap as this volatile part of healthcare lost almost 4%. Amgen (AMGN), one of the biotech staples, lost key support on Friday and has been tumbling since its late July high above 180. Take a look:
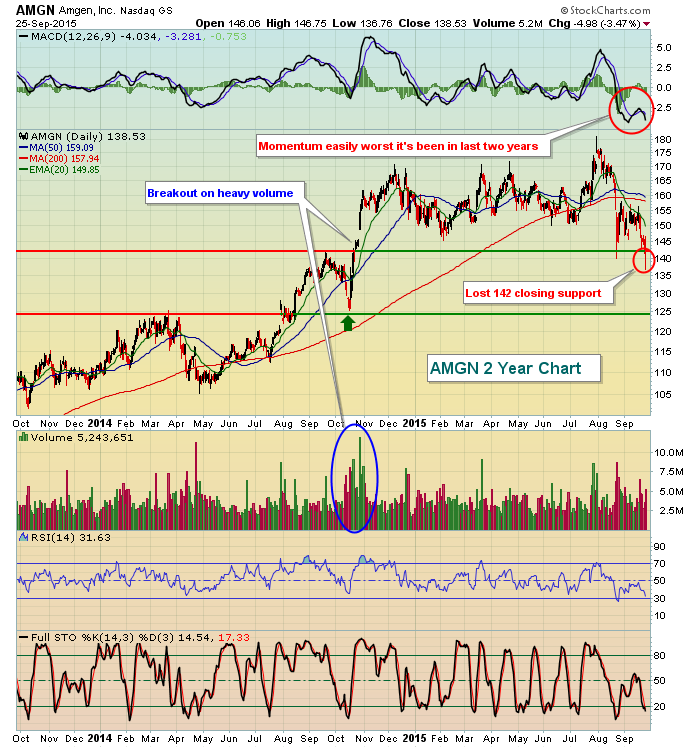
Barring a quick recovery and reversing candle today, AMGN appears poised to test its next price support level near 125. That's another 10% from Friday's close. Biotechs are a highly volatile group of stocks and when they sell, they often sell very quickly.
Pre-Market Action
It's another bad morning for U.S. futures. Losses in Europe are spilling over here. The France CAC was down more than 2% at last check while the German DAX is down another 1.5%. The S&P 500 tends to follow its European counterparts so it's no surprise that we're waking up to additional losses this morning. I've illustrated in recent weeks the close ties between German DAX performance and the performance of the S&P 500. Here's a chart showing that the correlation between the U.S. and France is also very positive. Check this out:
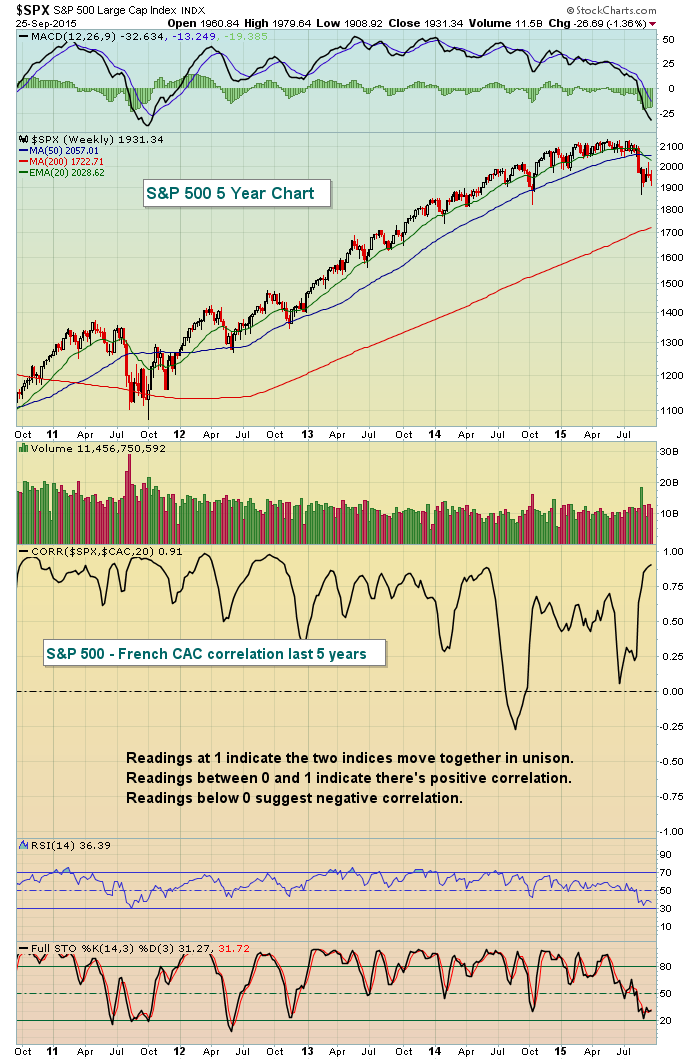
When we wake up here in the U.S. and see red all over the screen in Europe, it's not likely to be a good day here either. But while there's a positive correlation, it's not always a 100% positive correlation. So as you trade stocks here in the U.S., it's usually helpful to watch the European markets for intraday reversals. Occasionally, they'll start before the U.S. turns higher and can provide us advanced clues regarding intraday market direction.
Alcoa (AA) announced a separation into two distinct businesses that should be completed sometime in the second half of 2016. It is anticipated to be a tax-free deal for U.S. federal income tax purposes. Shareholders are probably wondering if AA should simply merge into Disney (DIS) and become its next ride at DisneyWorld. Check out this 15 year roller coaster:

2015 has been a nightmare for AA shareholders. Perhaps this separation will unlock some value inside the company. We'll see.
Current Outlook
I remain very cautious as we begin a new week. It's going to be very difficult to put any kind of a bullish slant on this market as long as it continues to trade beneath falling 20 day EMAs across all of our major indices. I will continue to make the long-term bullish case for equities, but short-term is a different story. Several of the "beneath the surface" messages support a continuing bull market, which is why I remain optimistic that this selling will run its course and then we'll turn higher again. That's what I'm expecting, but I am not long this market right now. Bear markets can take lots of different shapes. Rarely does one start exactly the same as the prior. The 2000-2002 bear market was all about the dot com bubble with technology getting crushed. The Russell 2000 held up quite well on a relative basis throughout much of that bear market. The 2007-2009 bear market was all about the financials as we had a near collapse of our financial system. Those who have been holding energy stocks for the past 14 months would argue we've been in a bear market as the XLE (energy ETF) has fallen from 98 in June 2014 to the August 2015 low of 58. Doesn't a 40% loss qualify as a bear market? Strength in other sectors, though, has masked the pain felt in the energy space.
Tread lightly for now. Opportunities will arise on the long side OR continuing weakness will ultimately underscore that a bear market has begun.
Sector/Industry Watch
Coal ($DJUSCL) is a very interesting area of energy to discuss. First, let's take a look at a long-term weekly chart:
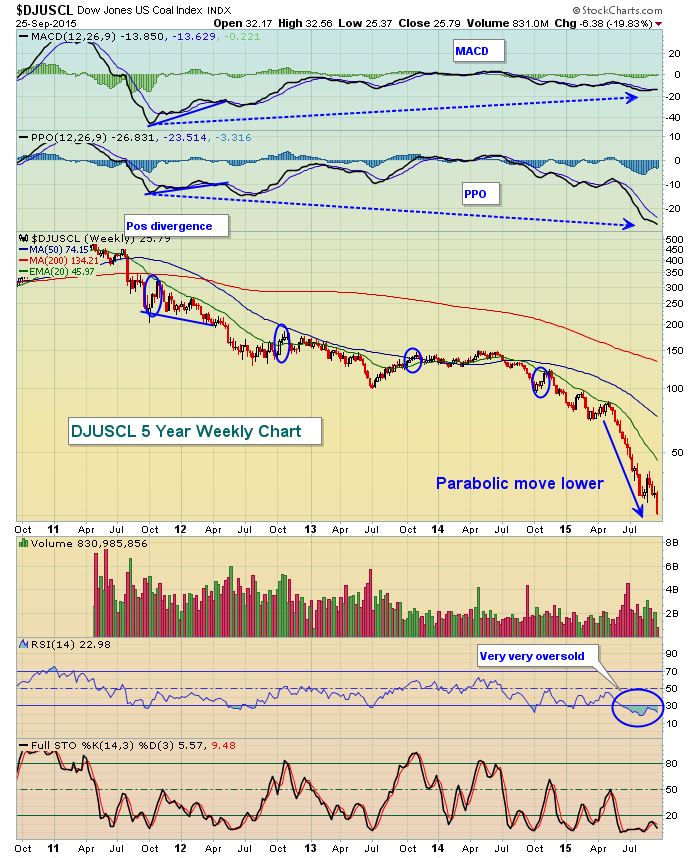
If you think about investing in coal or coal companies, you better have a very strong stomach because you can see the incredible volatility above. But note a few things here. The index is VIOLENTLY oversold with weekly RSI at 23. It's been in oversold territory (below 30) for several months now. It's simply due for some relief. And October has been the month to provide it historically. The DJUSCL ranks as one of the best performing industry groups during the month of October. Check out this historical strength using the StockCharts.com seasonality tool:
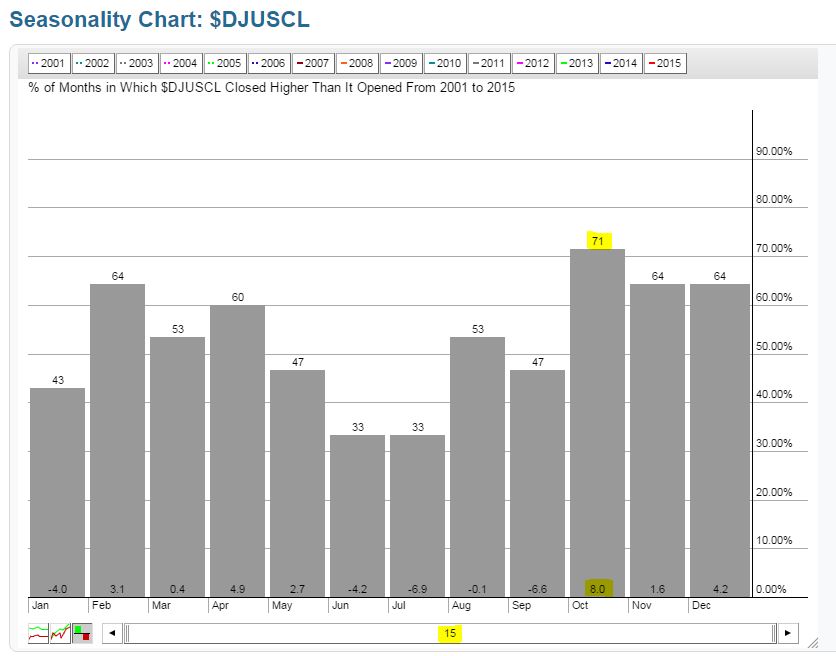
Over the past 15 years, the DJUSCL has risen 71% of the time, better than any other month. Its average return during the month of October is 8% and is surpassed only by internet stocks ($DJUSNS) in terms of industry performance over this period.
Going back to the weekly chart, I've circled the October performance of the DJUSCL for each of the past four years. Despite being in a downtrend for years, coal has managed to perform well each October. And check out the long-term positive divergence on the MACD that printed in 2012. It didn't work and I'm going to explain why during my webinar today at noon EST. I'll also talk about why the PPO is a better indicator than the MACD. One simple illustration is to look at those blue dotted lines. The MACD shows the current "momentum" reading to be much lower now than it was back in 2012, right? The PPO shows it to be much greater. Which is right? Well take a look at the chart and use some common sense. We've been in a parabolic move in coal to the downside. I think it's quite clear that the downside momentum is CRAZY STRONG right now. So why does the MACD fail us? I'll discuss it at noon. CLICK HERE to register for today's webinar (or check out the recording later today).
Historical Tendencies
Well, last week's warning about it being the S&P 500's 3rd worst week of the year historically was timely. All of our major indices struggled with concentrated weakness in materials and healthcare stocks. As we look ahead, October does show some blue skies in the distance but we'll have to navigate a difficult, volatile historical period for the next 3-4 weeks. I'll be providing interesting data throughout the period, so stay tuned. One interesting fact is that both the S&P 500 and NASDAQ struggle to close out September (28th through 30th), while the Russell 2000 tends to outperform on a relative basis. Given that the Russell 2000 is closer to August support, that may indeed be the case again this year.
Key Earnings Reports
None
Key Economic Reports
August personal income released at 8:30am EST: +0.3% (actual) vs. +0.4% (estimate)
August personal spending released at 8:30am EST: +0.4% (actual) vs. +0.3% (estimate)
August pending home sales to be released at 10:00am EST: +0.5% (estimate)
Happy trading!
Tom
