Market Recap for Thursday, September 3, 2015
First, if you're available, be sure to join me at noon EST today for my Trading Places LIVE webinar. It's free and you can register HERE. Also, you can "subscribe" to my blog and have this morning report sent directly to your email each and every day the stock market is open. To the upper right of this article, under "Subscribe to this blog", click on "Email updates". Enter your email address and hit "Subscribe" and this article will be sent to you IMMEDIATELY upon publishing. Thank you so much! Now a recap of Thursday's action.....
The volatility that we're seeing isn't just providing us a wild ride from day to day. It's hour to hour. Thursday was a perfect example. Futures spiked higher just before the U.S. market opened on the news that European Central Bank (ECB) Mario Draghi made reassuring and accommodative comments with regard to the European version of quantitative easing (QE). Specifically he mentioned that larger asset purchases are in their future as the recovery has been weaker than planned with renewed downside risks. Sound familiar? I think former Fed Chairman Ben Bernanke let Draghi borrow his notes from a few years ago. The QE "kool-aid" tasted pretty good at the opening bell as U.S. markets staged a nice rally and continued it until approximately 11am EST. Then the train derailed. On the NASDAQ, there were a couple of technical glitches. Take a look first at the daily chart, then the 60 minute chart below:
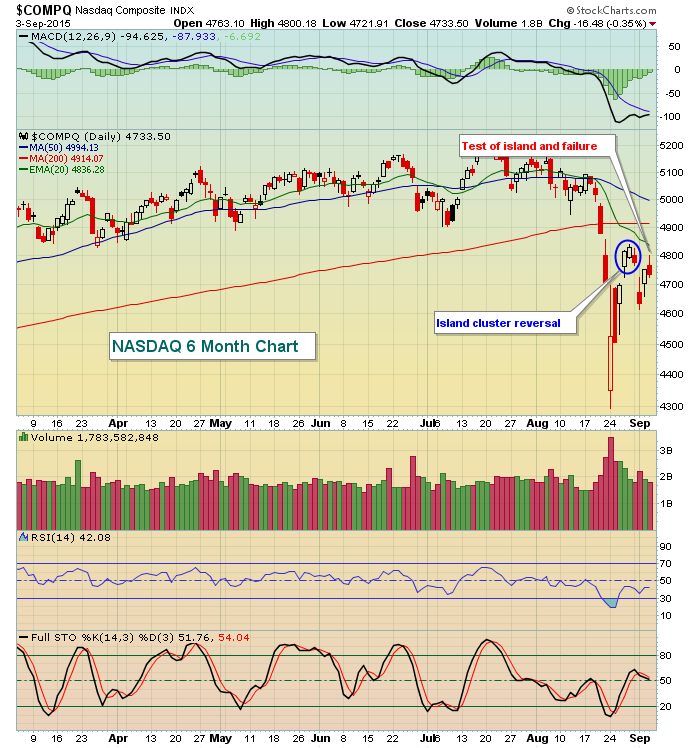
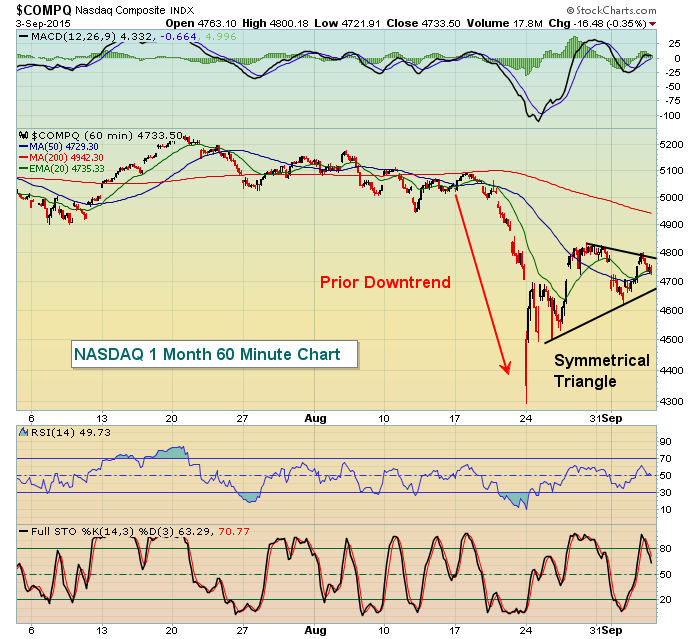
On the former daily chart, you can see the intraday action on Thursday clearly moved into an area that would have negated the prior island cluster reversal pattern. Instead, sellers reemerged and our major indices closed near their lows of the day. Poor technical action for sure. Worse yet, the second chart shows us on an intraday basis that the 4800 top was lower than the high we saw one week earlier. Those lower highs, combined with the higher lows over the past couple weeks have formed a bearish symmetrical triangle. It's bearish because these triangle patterns are generally continuation patterns, meaning they generally continue the prior trend, which in this case was clearly down. Given the weak futures and this morning's employment report, we could see this pattern confirm to the downside if the bulls don't put up a fight in early trading.
Sector performance on Thursday was strange with most of the strength coming from "non-aggressive" areas of the market. The groups that have mostly led the six year bull market were under fire on Thursday on a relative basis as healthcare, consumer discretionary and technology stocks all suffered on a relative basis.
Pre-Market Action
Futures were very weak overnight as Asian markets were mostly lower and traders contemplated all of the technical failures of late. Who wants to be long in the very near-term? I wondered to myself yesterday if anyone would want to buy this market into a key employment report with technical breakdowns everywhere. The last five hours of trading yesterday answered my question.
In the past few minutes, the August employment report was released and it showed that job growth was slower than expected - just 173,000 nonfarm payrolls were added. This compares to expectations of 223,000 and the reaction was negative with futures moving down to lows of the morning. At last check, it appears our major indices could open down approximately 1% although we all know how quickly this can change in a high VIX environment.
I'll be watching to see if the Tuesday lows hold. So here are those levels:
Dow Jones: 15979.95
S&P 500: 1903.07
NASDAQ: 4614.91
Russell 2000: 1124.46
Failure to hold these lows will probably result in another test of gap support from panicked open on August 24th. That would lead to losses of roughly 5-8% from current levels, depending on the index you follow. With the VIX spiking once again today, please be careful as whipsaw action in BOTH directions is likely to be the norm in the near-term. It's very difficult to harness your emotions during a roller coaster ride.
Current Outlook
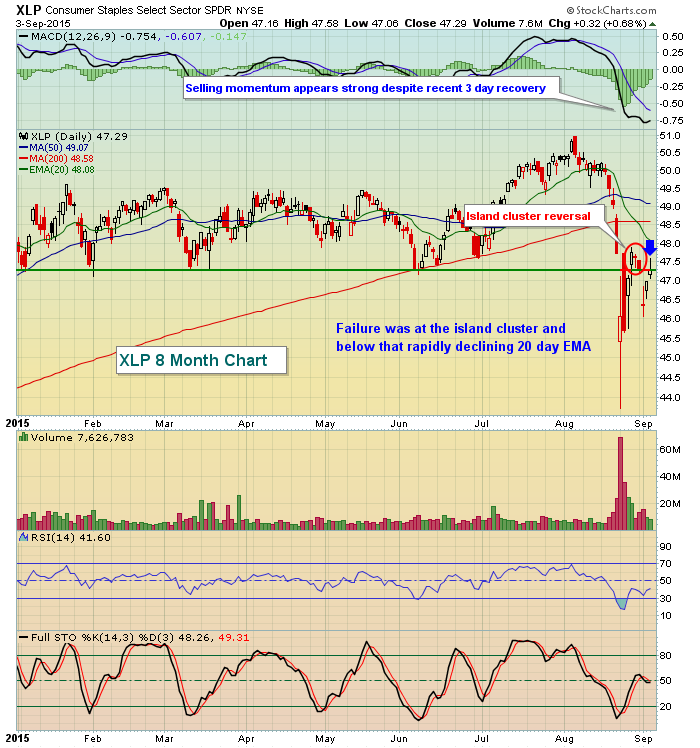
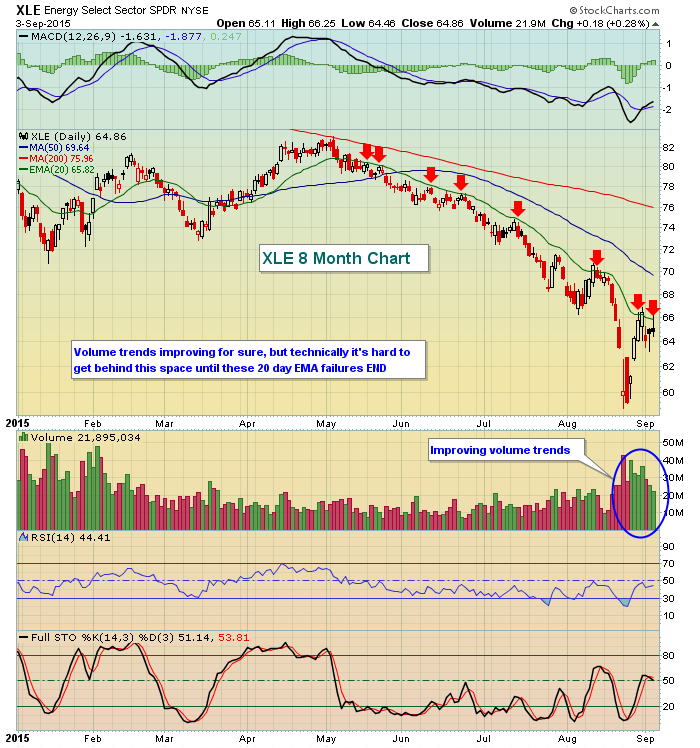
The problem currently is that technical buyers have nowhere to turn. In the short-term, nearly every corner of the market is in breakdown mode. So if you follow technical indications and you have money burning a hole in your pocket, you simply can't find anywhere to put your money to work. Consumer staples (XLP) had a very solid day on Thursday and energy (XLE) led the action higher through much of the day as well, but as I point out in the "Sector/Industry Watch" section below, both of these sectors ran into short-term technical brick walls and backed off.
For now, I still give the benefit of the doubt to the bulls and believe this is a correction, not the start of a bear market. However, I'm not ruling out the latter. The "below the surface" message doesn't really align itself with bearish thinking. I'll give you an example. I like to follow how transports ($TRAN) perform vs. utilities ($UTIL) on a relative basis. During a bull market, we should see higher relative highs and higher relative lows print as the S&P 500 moves higher. Thus far, we have. Check this out:
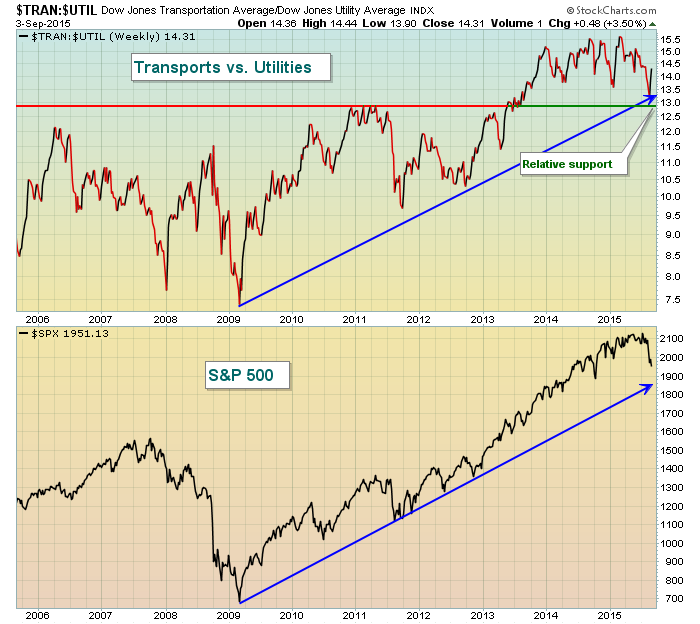
This chart just makes common sense to me. If our economy is expanding, profits will generally go higher. An expanding economy should be good for transportation stocks as more goods have to be transported. A strengthening economy typically requires the Fed to move into action, raising rates to keep our economy from overheating and to keep tight reins on inflationary pressures. Higher rates usually spell trouble for utility stocks as dividend seekers begin to shy away from utilities as treasury yields become more desirable. So the relationship that you see above with the transports:utilities ratio moving higher continues to support a bull market. But I've drawn a "line in the sand" that we need to watch near the 13 level. If that breaks, this "below the surface" message would begin to support further equity weakness ahead, possibly a bear market. Keep in mind this is just ONE below the surface analysis and there are several more that I follow. I'll be sure to provide those in future blog articles. But for now, the short-term technical breakdowns look more like a correction to me. We'll see, right?
Sector/Industry Watch
The strength in consumer staples (XLP) and energy (XLE) yesterday was nice but both sectors failed when it mattered most. First, let's look at the XLP:
Next is the XLE:
While I'd only view this as a correction for now, we need to see key areas of the market step up and become technical leaders again before growing more aggressive on the long side. I am perfectly content to simply watch the action for now and let others try to catch the roller coaster at exactly the right time.
Historical Tendencies
September is the worst calendar month on the S&P 500 since 1950. It has finished higher 45% of the time over the past 65 years and that percentage may not seem so bad. But it's the ONLY calendar month that goes up less than 50% of the time and there have been some ugly Septembers on record. It's the only calendar month with negative annualized returns (-5.77%). Since the year 2000, September has fallen more than 5% in 5 different years while it's risen more than 5% just once. So the bad occasionally turns very ugly and that's what we need to be aware of. These are TENDENCIES, not guarantees.
Key Economic Reports
August nonfarm payrolls: 173,000 (actual) vs. 223,000 (estimate)
Key Earnings Reports
Extremely light earnings calendar today and Monday.
I'll be back on Tuesday as the U.S. stock market is CLOSED on Monday for Labor Day so enjoy your long holiday weekend and happy trading!
Tom
