Market Recap for Friday, November 27, 2015
Action was solid on Friday, although a bit bifurcated. The Dow Jones was the only major index to finish in negative territory as this index of behemoth blue chip companies tries to negotiate short-term resistance from 17800-18000. Check out the visual:
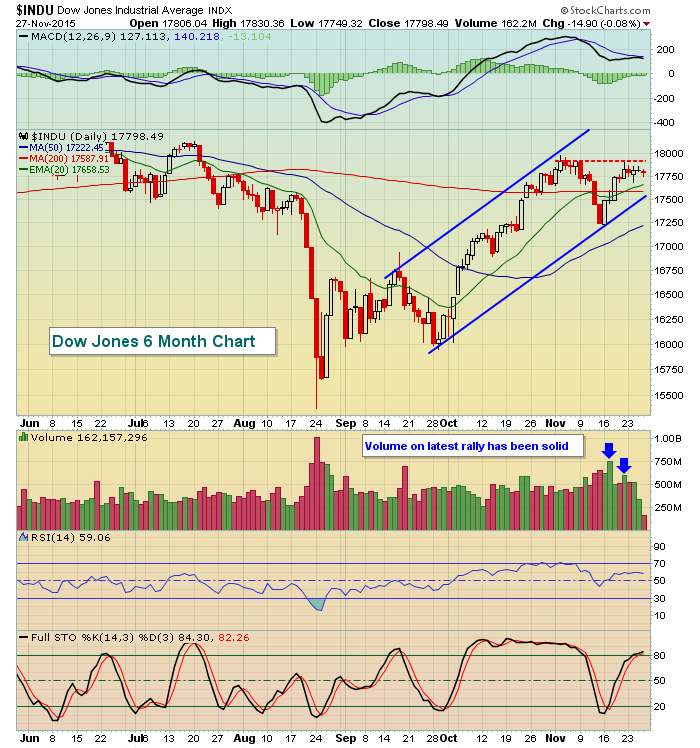
The Dow Jones has been trending higher and remains in a bullish uptrend, so I'll excuse the recent underperformance on a relative basis. To be honest, however, I prefer to see the Dow Jones and S&P 500 lag the more aggressive NASDAQ and Russell 2000. The next chart is used to illustrate the correlation between the INDU:COMPQ and performance on the S&P 500. What you'll see is that these two are inversely correlated. When the Dow Jones outperforms the NASDAQ, it's generally during periods when the S&P 500 is weak. When the Dow Jones underperforms, it's usually because we're in a bull market and NASDAQ shares are much more attractive because of their higher returns during uptrending prices. Check this one out:
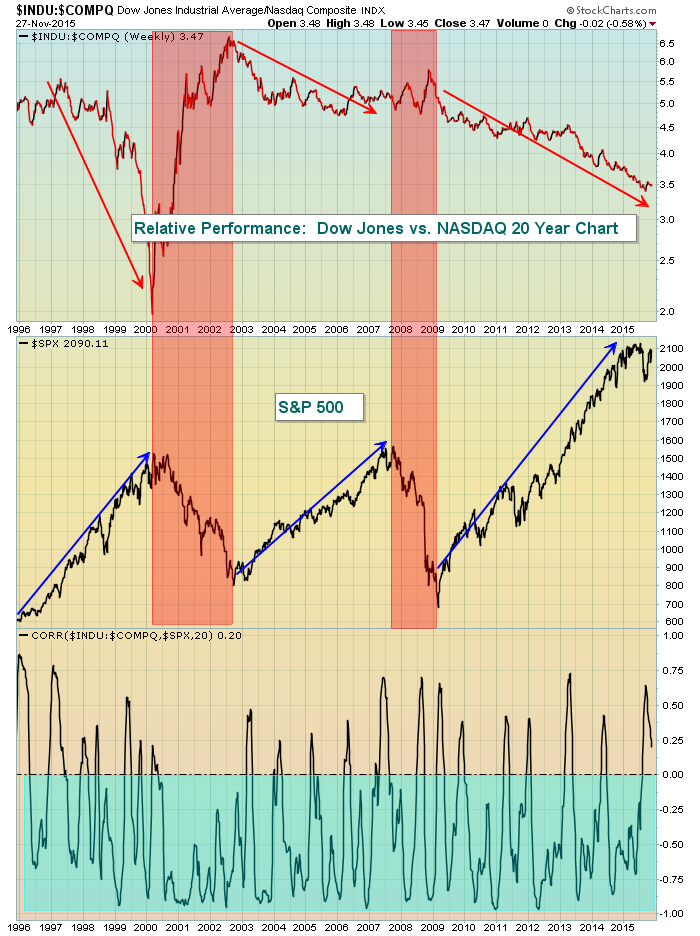
The red shaded areas above demonstrate the tendency for the Dow Jones to outperform on a relative basis as the INDU:COMPQ line moves mostly higher during bear markets. The blue shaded area at the bottom of the chart suggests that there's mostly a negative correlation between the INDU:COMPQ and performance of the S&P 500. This is simply one more way to highlight the fact that it's generally quite bullish to see money rotating towards aggressive areas (in this case the NASDAQ) of the market.
Pre-Market Action
U.S. futures are pointing to a higher open. Asian markets were mixed overnight while European markets this morning generally trade higher with a strong advance (+1%) in Germany. The DAX has been trading in very bullish fashion of late, bouncing off rising 20 day EMA support. This is bull market behavior, not bear market. I've illustrated countless times the strong positive correlation between the German DAX and S&P 500 so a strengthening DAX provides me yet another reason to expect higher prices here in the U.S.
The 10 year treasury yield ($TNX) remains near a key support level at 2.23%. As the Fed meeting draws closer, I'd expect to see selling of treasuries in anticipation of a rate hike. That will be somewhat dependent on how economic reports come out this week, especially the jobs report on Friday.
Current Outlook
Earnings season is primarily over now so the attention will turn to key economic reports and technical conditions. On Friday this week, we'll see the latest jobs update. If this report is solid, I would expect to see another surge in the 10 year treasury yield ($TNX) to anticipate the FOMC announcement later in December which is likely to report the Fed's first interest rate hike since June 2006. I believe the rate increase will happen and banks ($DJUSBK) and life insurance companies ($DJUSIL) will be major beneficiaries. The latter is currently in a very bullish continuation pattern, basing and awaiting its next breakout. That could occur in concert with that rate hike as life insurance companies, along with banks, tend to increase profits as rates rise. Take a look at this bullish chart:
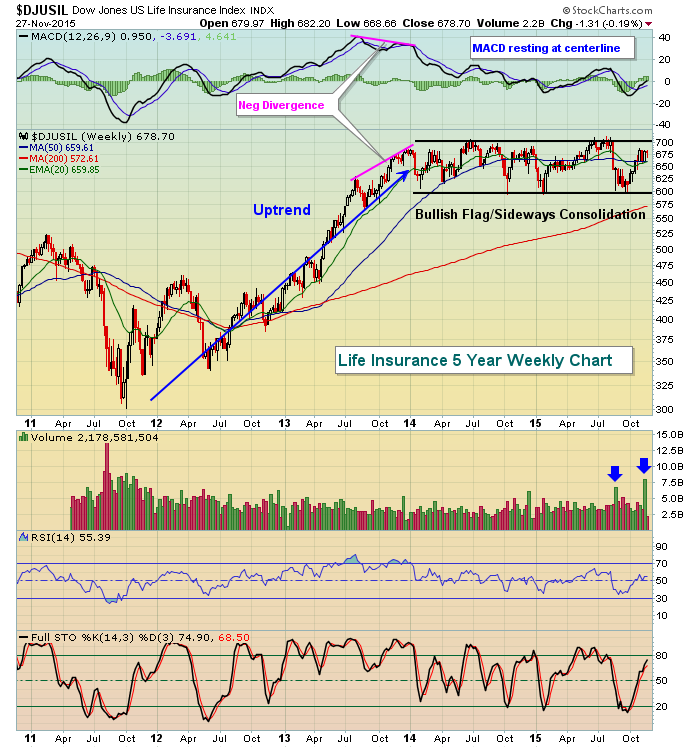
In my opinion, the next move here is likely to be higher. If I'm correct, companies like Unum Group (UNM) and Aflac (AFL) should perform well.
Sector/Industry Watch
Technology (XLK), like many areas of the market, seems poised for further gains in the coming weeks and months. The weekly MACD showed slowing momentum throughout much of 2015 with only pullbacks to rising 20 week EMA support. The last attempt at a new high was in July on very light volume and that too suggested momentum was waning. The late summer correction kicked in with the XLK falling back to challenge October 2014 lows before strength resumed. If you compare the 2015 correction to the 2011 correction, you'll see plenty of similarities in terms of slowing momentum, a MACD dip below centerline support, and a solid recovery back above key moving averages and the MACD centerline. Here's the weekly chart:
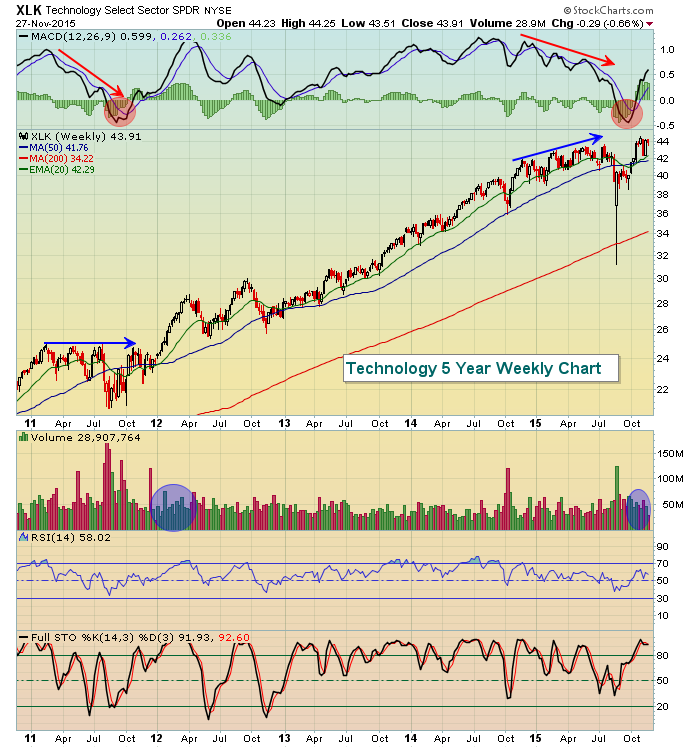
The red lines pointing lower emphasize that momentum was slowing as equal highs were made in 2011 and higher highs were made in 2015. The red circle shaded area highlights the negative momentum during the corrections. The blue circle shaded areas show that volume returned as the correction ended. The weekly MACD is now accelerating, which is indicative of increasing bullish momentum and volume has been strong to support his move. And historically December is a very bullish month for U.S. equities. I'm finding it very difficult to be bearish.
Historical Tendencies
We remain in the midst of a very bullish time of the year for small cap stocks (Russell 2000). The Russell 2000 has outperformed the S&P 500 in each of the past five trading sessions and is about to enter its best calendar month (December) BY FAR. The Russell 2000 has annualized returns of more than 40% during December and it usually finishes off November quite strongly as well. November 30th (today) carries an annualized return of 75.76% since 1988.
Key Earnings Reports
None
Key Economic Reports
November Chicago PMI to be released at 9:45am EST: 54.0 (estimate)
October pending home sales to be released at 10:00am EST: +1.0% (estimate)
Happy trading!
Tom
