Market Recap for Tuesday, November 24, 2015
Apparently, the U.S. stock market's shock absorbers are working just fine. After being dealt multiple blows in the early pre-market action - (1) weak European indices, (2) a list of poor quarterly results from the retail space and (3) a rise in global tensions stemming from Turkey shooting down a Russian warplane and the U.S. increasing terrorist threats - all of the major indices tumbled at the open. But by mid-day, we were higher once again as all of the early losses were erased. Energy (XLE) led the recovery with oil equipment & services ($DJUSOI) performing quite well after recently holding significant price support. Check it out:
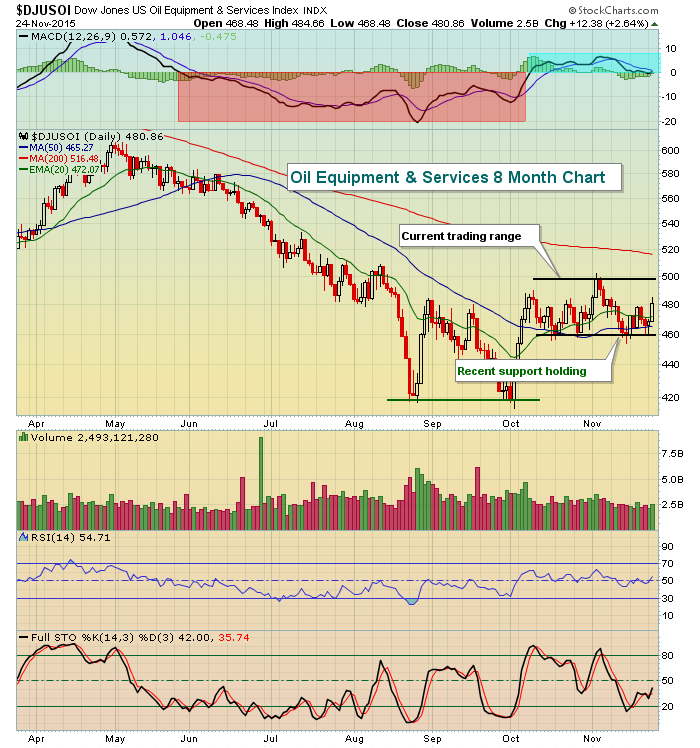
I'm watching the current trading range for now, but momentum (blue shaded area) favors more bullish action until proven otherwise. I've stated before that I believe energy has bottomed, so I'm looking for continuing strength in the sector and the various industry groups within. Therefore, I expect to see a breakout above this trading range. If we fail and break down instead, I'll reevaluate my position. Until then, my strategy would be to trade on the long side here.
Pre-Market Action
U.S. futures are quite strong this morning on the heels of the impressive Tuesday recovery. History is decidedly bullish the day before Thanksgiving - check out the Historical Tendencies section below for S&P 500 historical facts on the Wednesday before Thanksgiving Day. Hewlett Packard (HPQ) delivered disappointing results after the close on Tuesday, but Deere (DE) not only handily beat expectations for the current quarter, but they also raised Q1 sales guidance. DE was 4.5% higher at last check.
Global markets are mixed. Overnight, Asian markets were bifurcated, but we've seen solid strength in Europe as the European Central Bank (ECB) is reportedly considering the expansion of its QE program to including buying non-performing loans. We know that global markets love the smell of more QE so the response today is no surprise.
Current Outlook
Two things stand out to me currently.
First, the Volatility index (VIX) moved higher early on Tuesday given the trifecta of bad news. But it didn't remain elevated and is currently in the midst of a downtrend after topping at 20. That's not what you want to see if you're in the bullish camp. You want bad news to equate to a significantly rising VIX and price breakdowns in our major indices. We saw none of that on Tuesday.
Second, this is the time of the year when all of our major indices generally rise and the Russell 2000 ($RUT) tends to outperform on a relative basis. After two days of this bullish period, we're seeing it again. Take a look at the relative performance of the RUT vs. the S&P 500 (RUT:SPX):
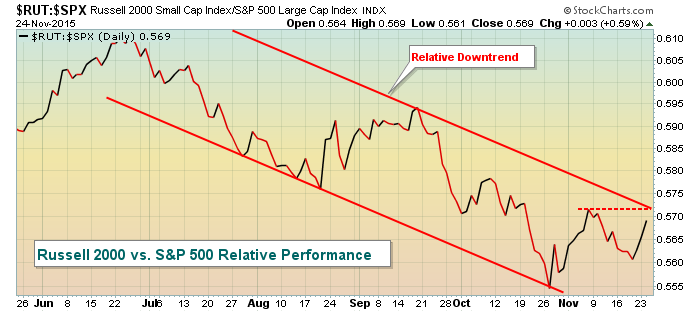
The relative downtrend line and the relative price resistance line both intersect near the .572 level. A break above that would indicate more interest by traders in the aggressive small cap space, a bullish development so keep an eye on that today and in the days ahead.
Sector/Industry Watch
Energy (XLE) enjoyed a nice day on Tuesday, leading the stock market to gains by the end of the day. Exploration & production ($DJUSOS) represented the "best of the best" with this index rising 2.62% on the session. A bottoming head & shoulders pattern is in place so a breakout above 725 should be respected with a measurement ultimately to 860. Here's the visual:
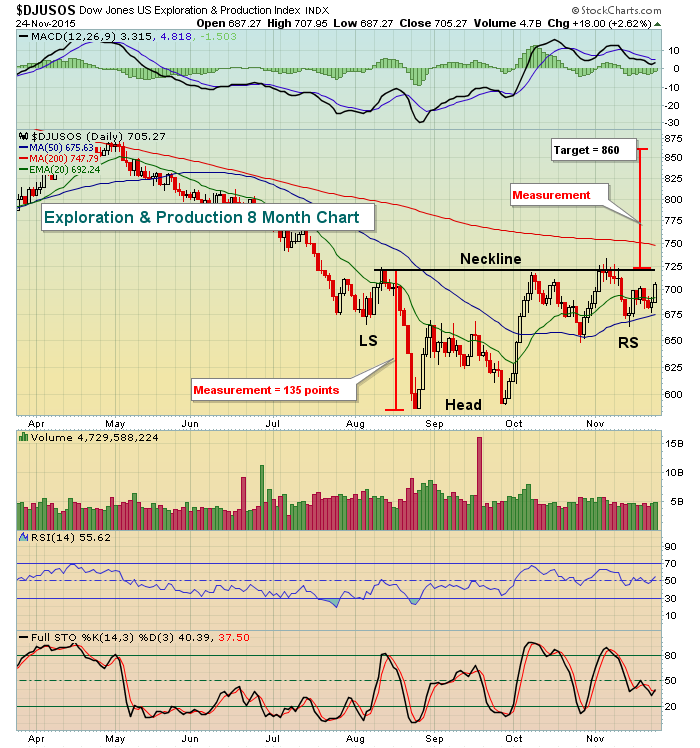
While energy has been showing many more bullish flashes of late, a breakout of a reverse head & shoulders pattern in a key industry group like exploration and production would only add to the bullishness into year end.
Historical Tendencies
The Wednesday before Thanksgiving has generally produced bullish days in the U.S. stock market. Since 1950, here's a breakdown of how many days the S&P 500 has moved higher the day before Thanksgiving vs. lower (by decade):
1950s: 8 up, 2 down
1960s: 7 up, 3 down
1970s: 10 up, 0 down
1980s: 9 up, 1 down
1990s: 6 up, 4 down
2000s: 7 up, 3 down
2010s: 4 up, 1 down
In total, the Wednesday before Thanksgiving has risen 51 times since 1950 and has fallen just 14 times. That's a HUGE historical bias in favor of the bulls today.
Key Earnings Reports
(actual vs. estimate)
DCI: .34 vs .33
DE: 1.08 vs .74
Key Economic Reports
October durable goods released at 8:30am EST: 3.0% (actual) vs. +1.5% (estimate)
October durable goods (ex-transports) released at 8:30am EST: +0.5% (actual) vs. +0.4% (estimate)
Initial jobless claims released at 8:30am EST: 260,000 (actual) vs. 270,000 (estimate)
October personal income released at 8:30am EST: +0.4% (actual) vs. +0.4% (estimate)
October personal spending released at 8:30am EST: +0.1% (actual) vs. +0.3% (estimate)
September FHFA house price index to be released at 9:00am EST: +0.4% (estimate)
November PMI services to be released at 9:45am EST: 55.0 (estimate)
October new home sales to be released at 10:00am EST: 499,000 (estimate)
November consumer sentiment to be released at 10:00am EST: 93.1
Happy trading!
Tom
