Market Recap for December 3, 2015
The European Central Bank (ECB) announced additional measures to stimulate economic growth, but it clearly was not enough for traders who've grown accustomed to quantitative easing (QE) in all shapes and sizes. That, combined with a very disappointing ISM manufacturing report a couple days ago and price breakdowns on heavy volume on Thursday have left the stock market quite vulnerable to further selling. It was ugly just about everywhere you turned. There wasn't much strength, except for areas that benefited from a tumbling U.S. dollar. If you recall, I presented a chart recently of the negative divergence on the dollar and thought we could see weakness in the greenback along with accompanying strength in gold and gold-related shares.
Here's a reprint of the USD chart:
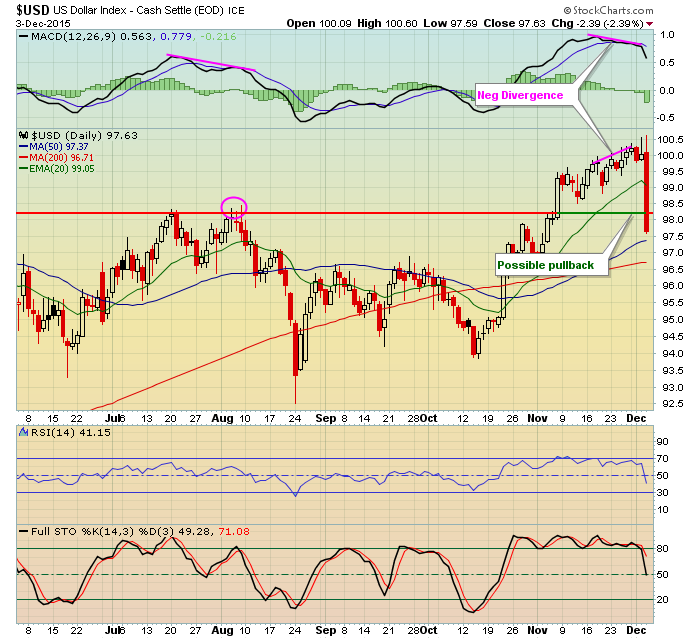
I was looking for a pullback over time to reach that 98.25 level. I really wasn't expecting it to happen in a day, but anything is possible when you begin to see negative divergences print. It warns us of heightened risk and in this case that skepticism was warranted - obviously. The huge selloff in the dollar prompted serious buying in gold mining ($DJUSPM) and precious metals ($DJUSPT), which rose 4.12% and 2.35%, respectively.
The selling began in Europe as Germany ($DAX) tumbled after the ECB's announcement. That seemed to carry over everywhere and while the U.S. didn't open that poorly, sellers claimed control of the action and the pace of selling accelerated throughout the day. The volatility index ($VIX) shot higher by 14% to close just above 18.00 and nearly reached that pivotal 20.00 level intraday. It's high was 19.35. Further spikes in the VIX could send traders flocking to the sidelines. All nine sectors were lower on Thursday although the defensive consumer staples and utilities fared best as they lost just .52% and .76%, respectively. On the other hand, healthcare and energy dropped 2.19% and 2.00%, respectively, leading the march lower.
Pre-Market Action
Traders are trying to absorb a lot of information this morning. Asian markets finished lower overnight in reaction to the selloff in Europe and here in the U.S. This morning, weakness continues in Europe though losses are currently contained in the 0.25% to 0.75% range. Germany is among the worst performing markets in Europe this morning.
There is plenty of good news out this morning in terms of jobs. Nonfarm payrolls for November outpaced expectations and October's nonfarm payrolls were adjusted 10% higher. The unemployment rate came in at 5% as expected. Everything seems to be in place for a Fed rate hike in less than two weeks. The 10 year treasury yield ($TNX) soared on Thursday, threatening the 2.35% short-term resistance area and it's testing that level once again this morning. The recovery after Tuesday's big drop and close below 2.23% was needed so equity markets can at least breathe a sigh of relief that the bond market is back on board with the concept of a strengthening economy ahead and higher interest rates. They appeared to question that on Tuesday with the poor ISM manufacturing number that was released.
Current Outlook
Germany bothers me. There were signs of slowing momentum there so I can excuse the selling on Thursday, but we have some key upcoming levels on the DAX that really need to hold to sustain the recent uptrend. First, check out the daily chart:
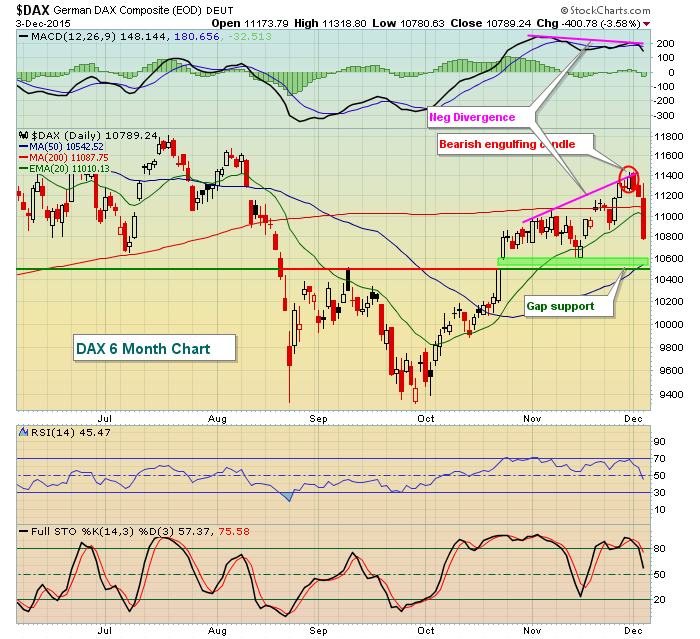
The DAX is lower again today and I'm watching the 10500-10600 zone as significant short-term price support. So if I trade U.S. stocks, why am I concerned with what's transpiring in Germany? Well, if you're new to my blog or webinar (today's webinar is at noon EST, you can register HERE), let me provide a refresher on how the S&P 500 correlates to the German DAX over long periods of time. Check this out:
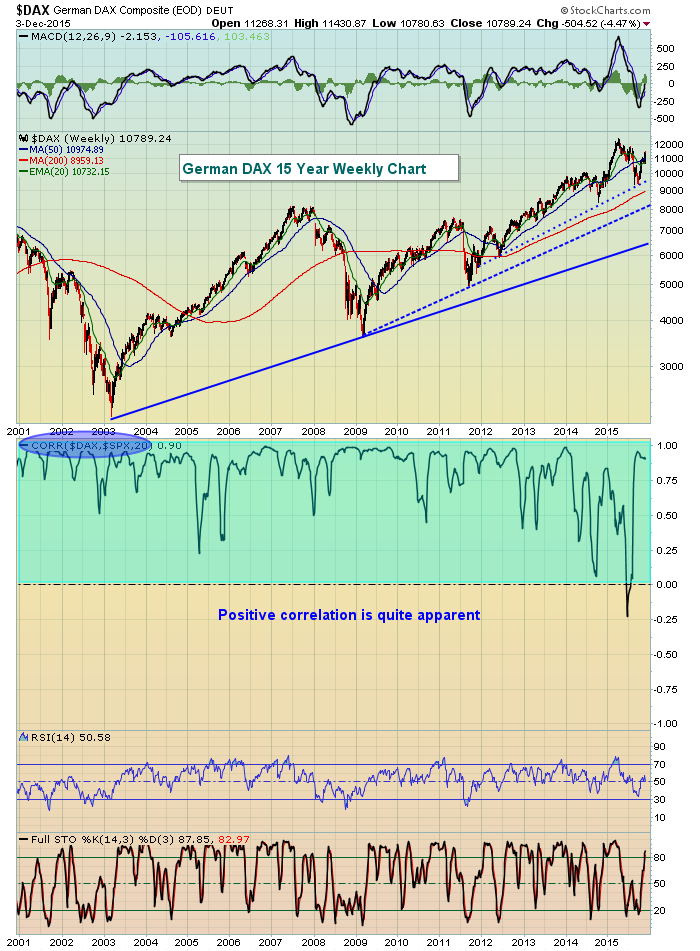
You can see a few things from this chart. First, a lot of the "important" levels on the daily chart represent noise on the weekly chart. The various trendlines on the weekly chart are much more important in the long-term than whether the DAX holds gap support from six weeks ago. Second, check out the correlation factor when comparing the DAX to the S&P 500. This correlation has been almost exclusively above zero for the past 15 years. In other words, these two indices tend to move in the same direction. Therefore, if we begin to see breakdowns or key areas of support failing to hold on the DAX, it's likely just a matter of time before the same happens on the S&P 500. That's why I get nervous when I wake up and the DAX is down 2%. More likely than not, the S&P 500 will tumble as well - just as we saw yesterday.
Sector/Industry Watch
Rather than a sector or industry group, let's check out the hourly chart on the S&P 500 to address the key intraday levels to watch as the action unfolds today:
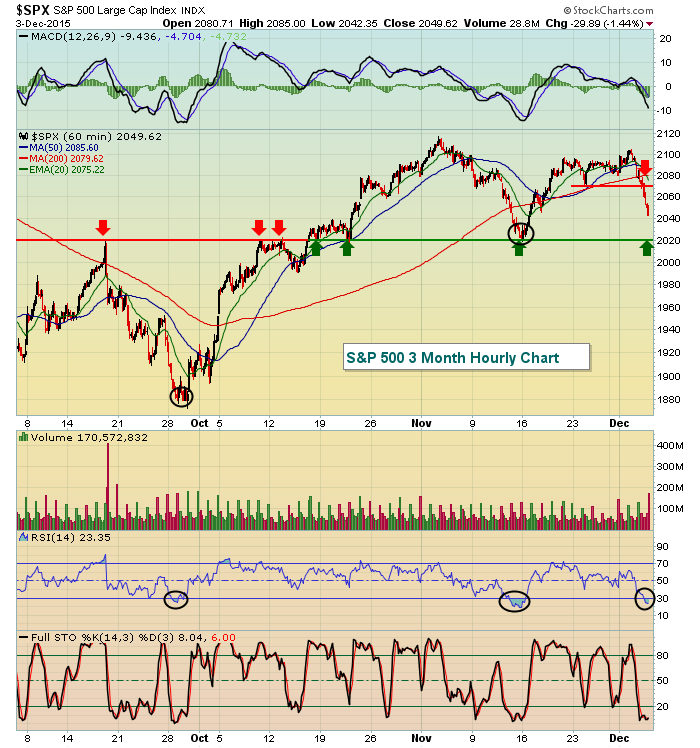
Clearly, that 2020 level has offered up both price support and price resistance several times over the past three months. It wouldn't be smart to ignore that level. I'd look for a bounce there on any weakness. Note also that the hourly RSI has dipped below 30 on three occasions with the third being yesterday. On each of the prior two occasions, we bounced. So again, it would seem likely that this 2020 would offer up support given the short-term oversold conditions on the RSI.
Today will be interesting for sure.
Historical Tendencies
While the November, December and January time frame represents the best three consecutive month period of the year for U.S. equities, we are about to enter a period where equities struggle. Beginning on December 7th (Monday), our major indices tend to underperform the average annual return that we see throughout the year until the close on December 15th. The good news? After December 15th, there's really not a better time to be invested than the period from December 16th through December 31st as traders tend to bid up prices through the holiday season.
Key Earnings Reports
None
Key Economic Reports
November nonfarm payrolls released at 8:30am EST: 211,000 (actual) vs. 190,000 (estimate)
November private payrolls released at 8:30am EST: 197,000 (actual) vs. 185,000 (estimate)
November unemployment rate released at 8:30am EST: 5.0% (actual) vs. 5.0% (estimate)
November average hourly earnings released at 8:30am EST: +0.2% (actual) vs. +0.2% (estimate)
Happy trading!
Tom
