Market Recap for Monday, December 28, 2015
On Monday, energy (XLE) did what it's done best in 2015 - it led the nine sectors to the downside by falling 1.82%, much more than the S&P 500's .22% decline. Materials (XLB), another 2015 laggard, fell .70% as the second worst performer on Monday. The XLE and XLB are down 22.26% and 9.11%, respectively, over the past year and are easily the two worst performing groups of 2015. In fact, excluding those two sectors, 2015 hasn't really been a horrible year. Yes, there's been a scare or two along the way, but most sectors will likely finish the year higher than they began. Consumer discretionary (XLY) has risen more than 10% over the past year, led by toys ($DJUSTY), broadline retailers ($DJUSRB) and footwear ($DJUSFT). Activision (ATVI), Amazon.com (AMZN) and Skechers USA (SKX) have been big winners within those three industry groups, sporting gains of 93.09%, 118.45% and 62.90%, respectively.
But let's get back to energy. It certainly seems as though this space needs to attract money on a relative basis if the near 7 year bull market is to resume with fresh all-time highs on the S&P 500. Check out this chart:
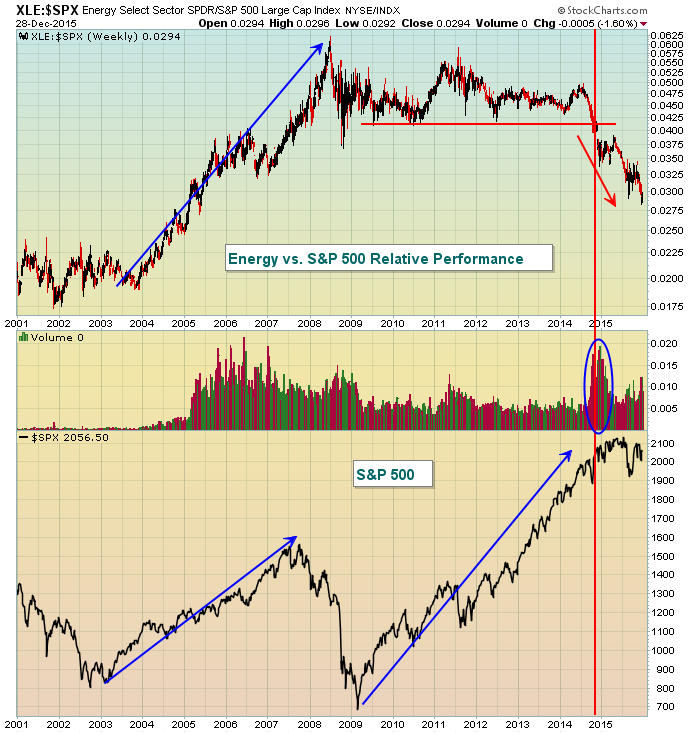
A few points regarding this chart. First, note that the XLE:$SPX relative line was accelerating to the upside during the 2002-2007 bull market. That illustrates the relative strength of energy during the last bull market. The 2009-2015 bull market has been a completely different story. Energy did perform "ok" on a relative basis through late 2014, going along for the ride. But check out the relative breakdown in late 2014 below the .0415 relative support line. Once that occurred, heavy selling (blue circle) accompanied a mass exodus out of energy stocks. That very strong relative weakness has held back this bull market. We would be at all-time highs on the S&P 500 if it weren't for the poor performance of energy shares. The good news is that crude oil prices ($WTIC) have hit long-term price support. A bounce in oil prices in 2016 would be the catalyst behind stronger relative performance of energy. I expect that to occur in 2016 even though it's difficult to pinpoint an exact turning point. Perhaps technical price support will be the answer. The WTIC is reviewed today under the Sector/Industry Watch section below.
Pre-Market Action
Futures here in the U.S. are quite strong and near their highs of the pre-market session as they follow the lead of key European indices. The German DAX is up roughly 1.8% this morning and nearing its early December reaction high close at 10886. A close above this level should provide the bulls impetus to challenge the high set earlier in December closer to 11400. Such bullish action there would no doubt help the S&P 500 as I've illustrated the positive correlation between the two indices on many occasions here in this blog and in my webinars.
Asian markets were also higher overnight and contributing to the early gains here in the U.S.
There'll be some housing data (Case Shiller) and consumer confidence out later this morning, which could play a key role in whether short-term resistance is cleared on the S&P 500.
Current Outlook
Today, let's look at an intraday chart as the recent range-bound back and forth action has done little to longer-term prospects. Check out this hourly chart:
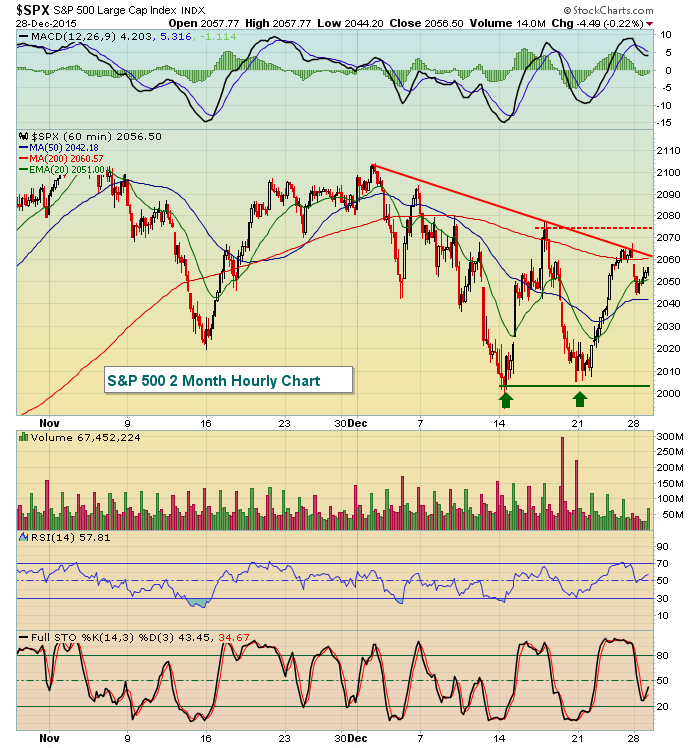
On the longer-term daily chart, I'm watching key all-time high closing resistance at 2131. Performance in December, however, has been weak despite historical tailwinds. It should make sense that in order to have any shot at clearing daily resistance at 2131, the bulls will first need to clear intraday hurdles. Initially those levels will be 2060 (trendline resistance - solid red downsloping line above) and then the reaction high price resistance at 2075. That level is important because it falls between the two lows just above 2000 that mark a potential double bottom.
Sector/Industry Watch
Crude oil prices ($WTIC) have fallen more than 30% in 2015 and that's had a huge impact in terms of relative underperformance in energy stocks. But there is good news - at least with respect to technical price support. The WTIC has fallen precipitously, but has hit MAJOR price support. A bounce from this level could propel energy stocks back into a leadership role in 2016. Here's the visual:
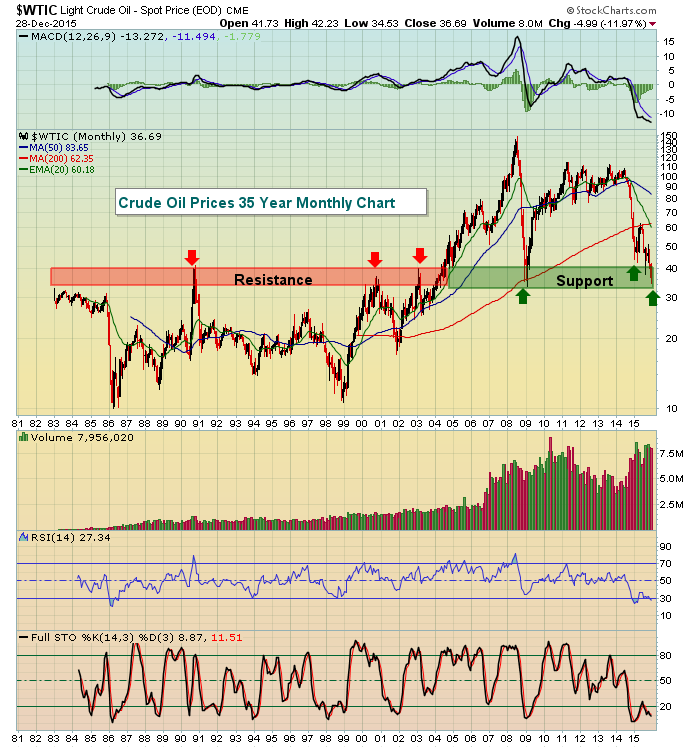
There are many analysts forecasting crude oil in the $20 per barrel range. Obviously, if those dire forecasts come true, the XLE is likely heading lower. But I'd be careful to assume that long-term price support in the 35-40 area will not hold. Those who hold a more bullish view of the XLE in 2016 are banking on rallying crude oil prices and this chart provides that hope.
Historical Tendencies
Looking ahead, annualized returns on the S&P 500 are very strong to begin the year. Here are the following annualized returns by day on the S&P 500 since 1950:
January 4 (Monday): +16.23%
January 5 (Tuesday): +35.82%
January 6 (Wednesday): +25.33%
January 2nd and 3rd sport annualized returns of +71.26% and +62.06%, respectively, but these two days fall on Saturday and Sunday in 2016. Perhaps some of that historical strength will be felt on the 4th and 5th this year.
Key Earnings Reports
None
Key Economic Reports
October Case Shiller 20-city home price index to be released at 9:00am EST: +0.6% (estimate)
December consumer confidence to be released at 10:00am EST: 93.5 (estimate)
Happy trading!
Tom
