NOTE:
I will be out tomorrow so I won't provide my next article until Monday, January 4th. HAPPY NEW YEAR! I'm wishing everyone health and happiness in 2016.....and of course great trading results! Do me a favor. At the bottom of this article, click on the "YES" button to subscribe to my blog. It's simple and FREE. By providing your e-mail, you'll receive all of my blog articles directly to your email the moment they're published. All of the blog authors here at StockCharts.com appreciate the subscriptions! Thanks for your support in 2015 and I look forward to an outstanding 2016. Again, thanks and happy new year!
Market Recap for Wednesday, December 29, 2015
All nine sectors rose on Wednesday in a wide rally that was sparked by technology (XLK) and consumer discretionary (XLY), two aggressive sectors. Healthcare (XLV) was another area that led the advance with key strength in biotechnology stocks ($DJUSBT), the most aggressive area in healthcare. Rallied led by aggressive areas of the market are the best kind because they demonstrate that market participants are willing to take higher risks to achieve higher returns. This is a hallmark of bull markets. Technology remains one of the most bullish looking sector charts as reflected below:
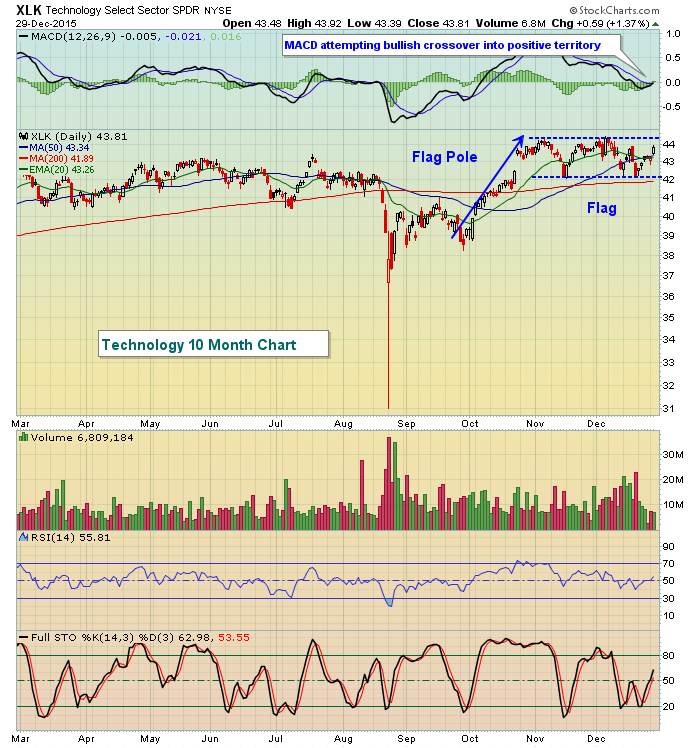
The XLK is sideways consolidating after an uptrend, which is generally a bullish continuation pattern that results in an upside breakout to follow the prior trend. Whether or not the XLK makes the breakout could depend greatly on whether its leading industry group - internet ($DJUSNS) - makes its breakout first. I've featured the DJUSNS chart in the Sector/Industry Watch section below.
Did you notice the move out of treasuries yesterday? The selling of treasuries sends corresponding yields higher and provides liquidity necessary to drive up equity prices as well. The 10 year treasury yield ($TNX) soared on Wednesday as it approaches a key short-term test near 2.35%. A breakout in the TNX would be bullish similar to a breakout in the XLK. These are big pieces of a rather large and complicated jigsaw puzzle. Check out the mass exodus among treasuries and the big corresponding rise in the TNX Wednesday:
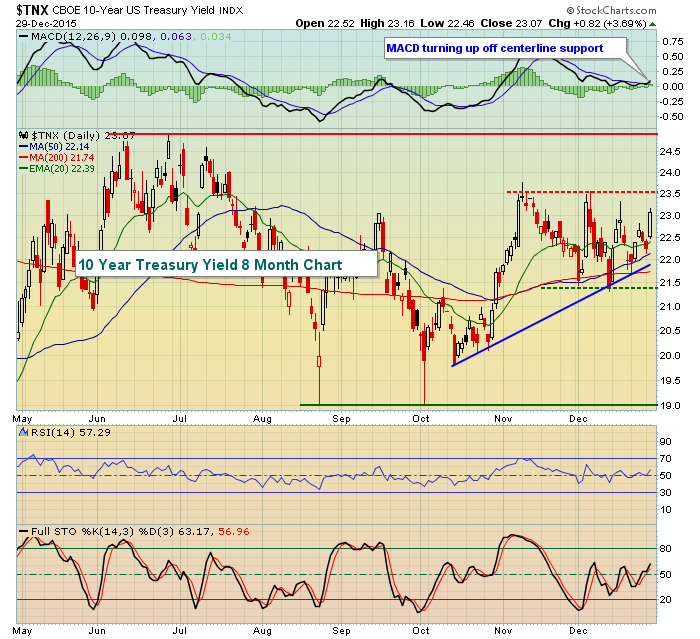
The TNX shot higher on Wednesday to close above 2.30% for only the second time in December. The dotted lines mark short-term support (green) and resistance (red). The solid green and red horizontal lines mark intermediate-term support (green) and resistance (red). Note that the MACD had settled back to centerline support, which is indicative of zero momentum. In other words, there's been a virtual stalemate between treasury bulls and bears of late. The MACD does seem to be showing more bullish momentum of late so a breakout above 2.35% should be respected. The further selling of treasuries would be a potential catalyst for a breakout in the S&P 500 to all-time highs.
Pre-Market Action
U.S. futures are down as traders look to book early profits after yesterday's rally. Global markets are lower with underperformance in Germany. There'll be little in the way of news today as there are no earnings of significance and the only economic report is November pending sales, due out at 10am EST. Also, with New Years Day approaching, expect volume to tail off and action likely to be less volatile.
Current Outlook
There were a number of positive developments in the Wednesday rally. The selling of treasuries supports the theory of a strengthening economy ahead and a continuing rally and breakout on the TNX would further confirm this. Finally, we saw money rotating into a few aggressive areas of the market. History tells us this is an important and necessary component to sustaining a bull market advance. Given the current bull market is extended and approaching the 7 year mark, this is an important development. The problem, though, is that we're not seeing a fully convinced group of traders.
The biggest problem is that the market has not surged to higher highs. EVERY uptrend requires a higher high. You can't continue a bull market without them. So first we must see a breakout to confirm the bulls' hopes of higher equity prices in 2016. That one is rather obvious. Less obvious are the sinking XLY:XLP, $TRAN:$UTIL and $RUT:$SPX ratios. While the S&P 500 resides within 3% of a potential breakout to an all-time closing high, these three ratios are telling us a very different story - and a potentially bearish one. Look at this recent action:
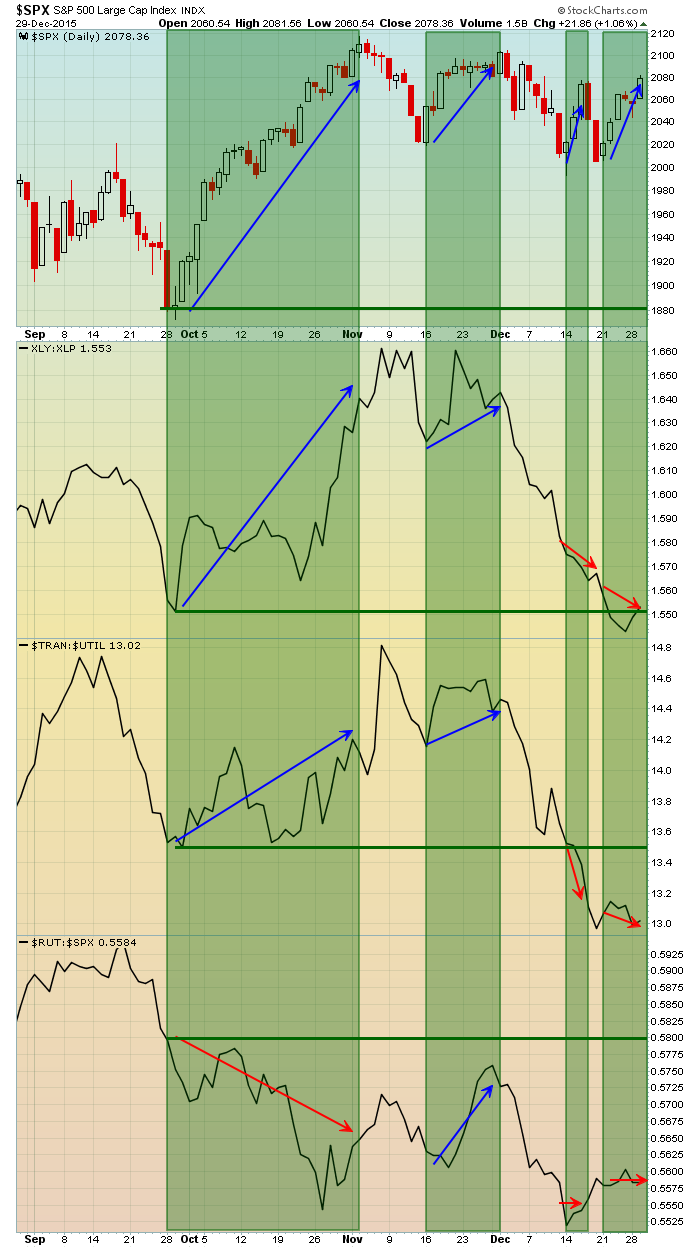
The top chart above is the S&P 500 followed by the XLY:XLP, $TRAN:$UTIL and $RUT:$SPX. The significance here is that these ratios show if money is rotating INTO or OUT of aggressive areas of the market. I've never seen a bull market extended long-term when the S&P 500 is rising while these three ratios are falling. And it makes sense because if money is shifting towards defensive areas of the market, that suggests that market participants are anticipating potential trouble ahead. They are NOT COMMITTED to the rally. The S&P 500 hasn't broken out yet and if it does, it will be very interesting to see how these ratios react. They need to move higher. Having said all of this, the combination of price/volume trumps every other indicator including MACD, RSI/stochastics, intermarket ratios, etc. But a breakout to all-time highs with declining ratios above would be sending a MAJOR RED FLAG. Buyers beware.
Sector/Industry Watch
Here's an update on the Dow Jones U.S. Internet Index ($DJUSNS):
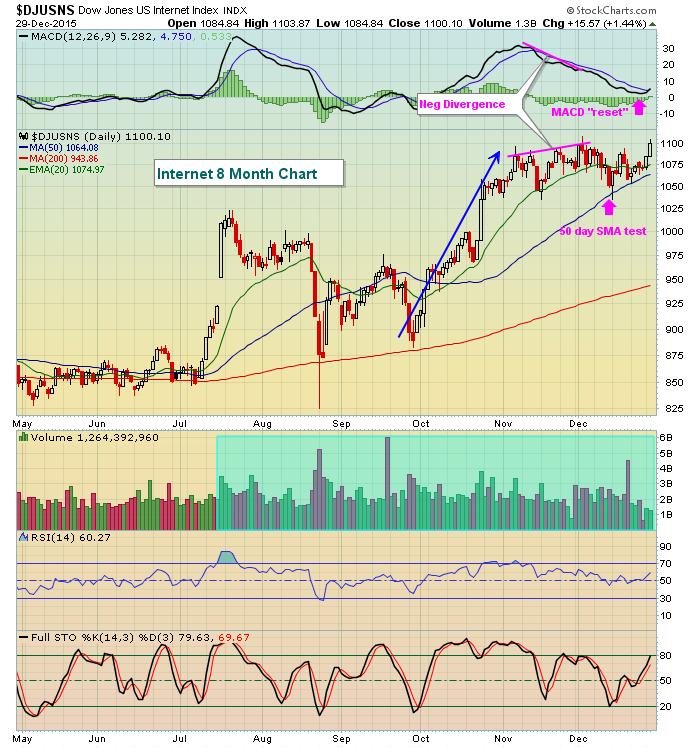
There's A LOT we can learn from this chart. First and foremost, there's obviously been a huge rally that's taken place. Price and volume trends turned quite bullish back in July. That's when we saw a significant price breakout (GOOGL earnings triggered the breakout). Since that time, we've seen a series of higher highs and higher lows. That's the definition of an uptrend. Note, however, that momentum began to slow in early December as the price of the DJUSNS rose again while its MACD was falling. This negative divergence suggested caution with a potential 50 day SMA test and MACD centerline test ("reset"). When negative divergences arise, trades in the space become potentially dangerous as the uptrend is not nearly as sustainable as during prior surges higher. That results in a lot of wasted capital and frustration as the industry group underperforms for a period of time. But note the pink arrows that show a 50 day SMA test, as well as a near centerline test. A breakout now above 1100 would be supported by a MACD that now appears to be turning higher. Also note that the RSI is at 60 with room to move higher.
Historical Tendencies
Our major indices have shown better than average returns in the weeks leading up to earnings season as traders anticipate strong earnings. We're currently experiencing sideways, volatile action on all of our major indices, but I'll be watching to see if the rally yesterday can continue into year end and if it results in key breakouts among our sectors and industry groups. Such breakouts will provide us clues as to future bull market leadership.
Key Earnings Reports
None
Key Economic Reports
November pending home sales to be released at 10:00am EST: +0.5%
Happy trading!
Tom
