Market Recap for Monday, January 4, 2016
China's Shanghai Composite ($SSEC) sent global markets lower on Monday after the SSEC shred nearly 7% of its value. Asian markets tumbled and those losses triggered sizable gaps lower in Europe and here in the U.S. A late rally in U.S. stocks did manage to print hammers on key indices, but those hammers require that their lows of the day (or commonly referred to as "tails") hold as support. Futures are lower this morning so I'll be watching to see if intraday support from Monday holds. Here's the visual of the reversals and "kick saves" on both the NASDAQ and S&P 500 with yesterday's late reversal:
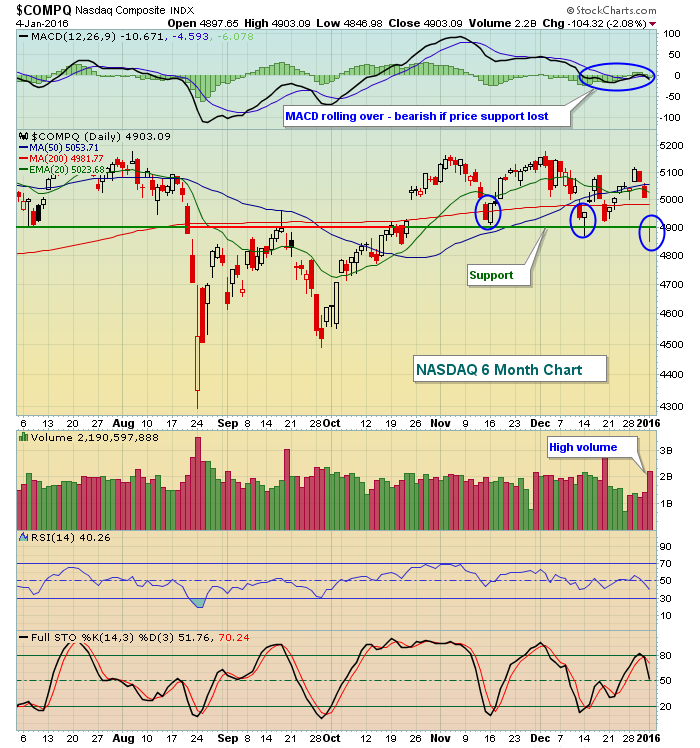
The 4900 level has proven to be solid support/resistance on several occasions, making it much easier for most traders to see. That suggests it's an important short- to intermediate-term support level. The blue circles identify three reversing candles - the first a bullish engulfing while the last two are both hammers - that all printed at or very near this 4900 support. Hammers are short-term reversing candlesticks. They don't indicate that a long-term bottom has been set. We would need a breakout to fresh all-time highs to confirm that. The reversal did, however, take place on heavy volume. That tells me this is an important level and Monday's intraday lows need to hold to avoid further short-term selling.
Here's the S&P 500's visual:
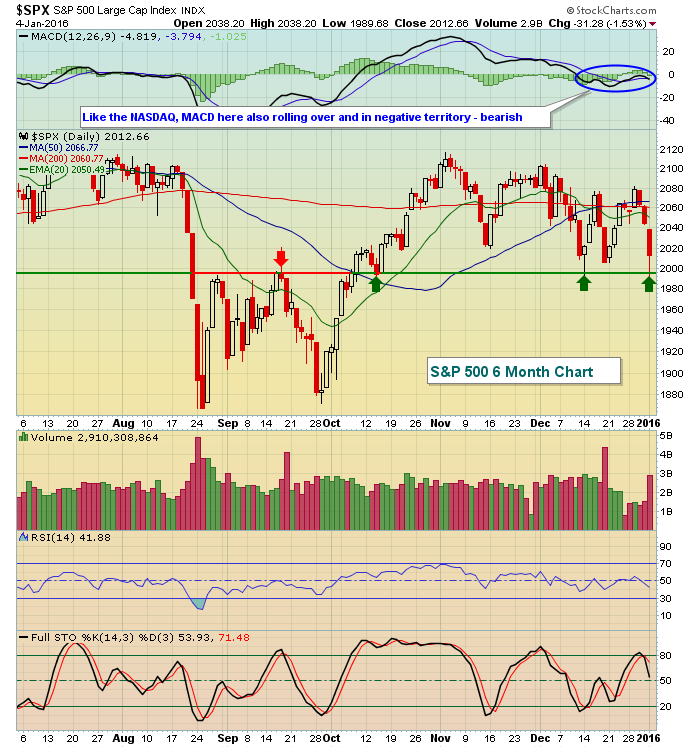
The reaction high in September off the huge drop in August was near 1995. After breaking above 1995 in early October, you'll see 3 green arrows that mark tests of this breakout level. On Monday, the S&P 500 fell just below 1990 before reversing and once again closing above 1995. A close below 1995 is what you want to see if you're leaning to the bearish side while clearly you want this successfully tested level to continue to hold if you're long. 1995 is NOT the major level long-term. That resides at the October 2014 and August 2015 lows, in my opinion of course. But if you're trading strategy is short-term, 1995 marks a very important level.
Seven of the nine sectors lost more than 1% on Monday, led by financial (XLF) shares. The beaten-down energy (XLE) sector and the defensive utilities space were spared. Otherwise, the bulls absorbed quite a beat down on the session.
Pre-Market Action
Earnings reports have been very light, but will soon begin to pick up. In addition, there are no key economic reports out today. With little fundamental news, traders are left to ponder global worries and technical conditions, the latter of which to be honest are on the brink of an intermediate-term breakdown. Therefore, let's keep an eye on Asia and Europe for clues. Overnight, Asian markets were once again lower, but this time just fractionally. So at least fears of another giant drop have been alleviated and that should help markets in Europe and here. At last check, European indices are mostly higher, albeit fractionally.
In Germany, the DAX closed on Monday beneath its pivotal 10500 level. From the chart below, you can see that the short-term picture remains "cautious" at best:
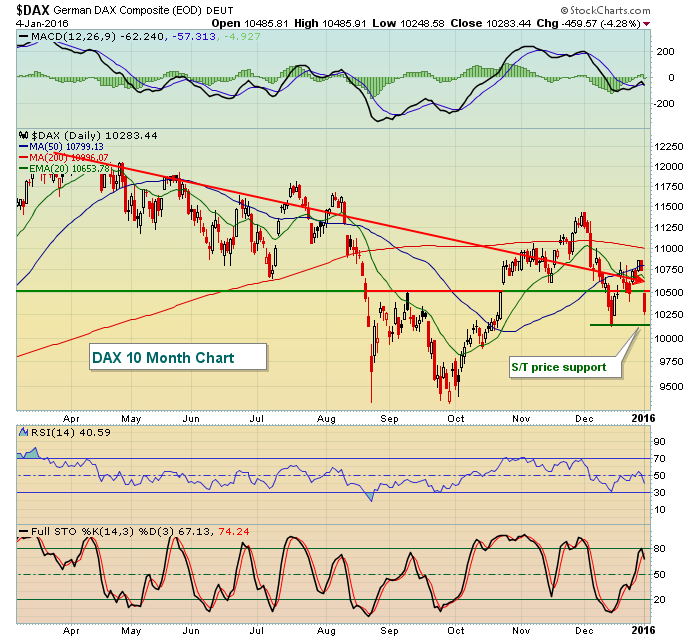
The red arrow is clearly illustrating a downtrend in play, 10500 support was lost and the daily MACD is below its zero line and turning lower. What could be bullish, right?
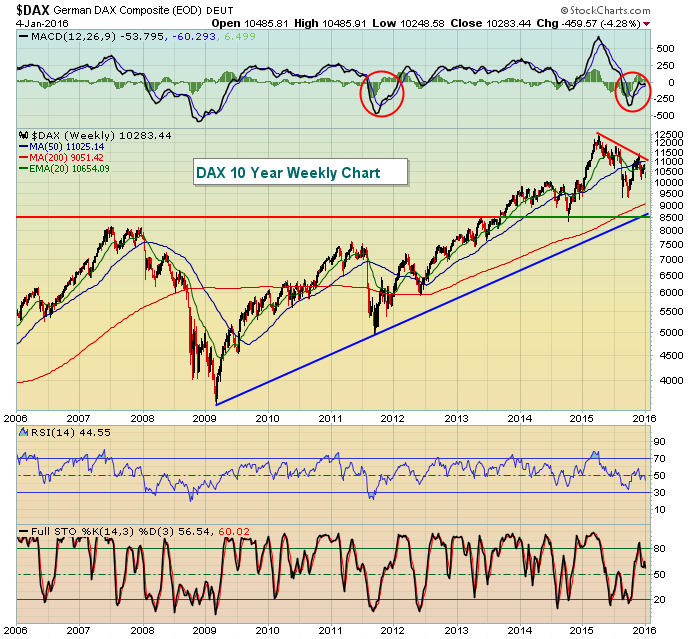
Does the long-term chart look like the trend is higher or lower? To me, it's clearly higher and the 7 year bull market is obvious. The red downtrend line shows the short-term downtrend that was highlighted in my previous chart, but this short-term downtrend is within the confines of a much more bullish long-term picture. Therein lies one of the problems of growing too bearish the stock market right now. Germany experienced a parabolic rise in the fourth quarter of 2014 and first quarter of 2015 and it's been consolidating in what appears to be a bullish symmetrical triangle ever since. In this long-term chart, resistance is more than 2000 points higher (near 12500) and support can be found at the intersection of price and trendline support - nearly 2000 points lower. In other words, the long-term chart could support much further selling and remain in an overall uptrend. That's how corrections are borne and the one above in 2011 is pretty clear. If short-term support is lost, I'd argue the odds of deeper selling increase significantly, but I'd still remain bullish longer-term and expect a major rally to follow any period of selling that we might see in 2016.
Current Outlook
One big problem (again) for the bulls is that traders have grown very jittery. The Volatility Index ($VIX) spiked to its highest close since mid-December and finished back above 20, which has been a battleground for stocks. VIX levels above 20 "can" trigger violent selling so be careful especially if the price support levels on the NASDAQ and S&P 500 provided above are lost. As a refresher, here's a chart that illustrates the technical damage that can be inflicted on the S&P 500 when the VIX is above 20 and on the rise:
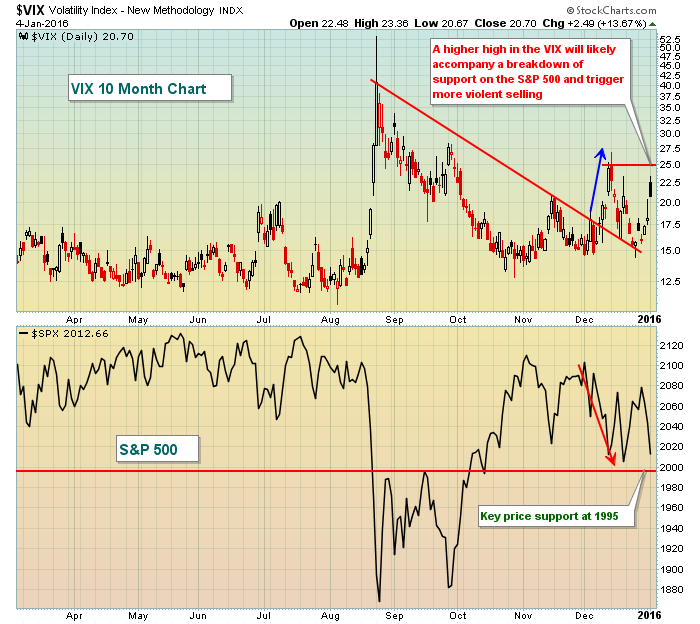
The VIX is a key sentiment indicator and a rising VIX is synonymous with rising fears.
Sector/Industry Watch
Energy (XLE) performed very well on a relative basis yesterday as crude oil ($WTIC) bulls continue to make a case for long-term price support in the mid $30s per barrel holding. Here's an updated look at the XLE:
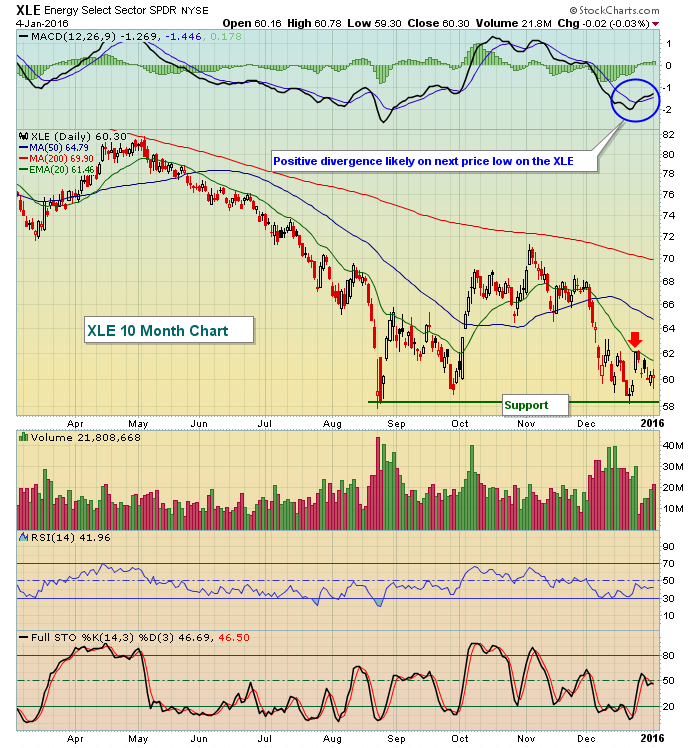
While the recent relative strength is most likely due to the fact that energy shares were simply very oversold, the technical picture does appear to be improving. In addition to key price support near 58.00 right around the corner, the daily MACD has turned noticeably higher. That tells us another price drop near 58.00 will print a positive divergence, an indication of slowing price momentum to the downside. Heavy volume selling below 58.00 would be bearish, but a lighter volume move through 58.00 could provide a nice short-term opportunity on the long side.
Historical Tendencies
The S&P 500's 1.53% loss on Monday was the worst start to a year since 2001 when the S&P 500 lost 2.80%. 1980 and 1983 were the only other two years since 1950 where the S&P 500 has lost more than 1.53% to open the year. In both 1980 and 1983, the opening day losses were recovered quickly. We'll find out if that's the case in 2016.
Key Earnings Reports
None
Key Economic Reports
None
Happy trading!
Tom
