Market Recap for Wednesday, February 10, 2016
There was a bit of strength on Wednesday as the NASDAQ managed to finish with a minor gain, while the remaining key indices gave up earlier gains to end the session in negative territory. The bifurcated action was very disappointing to those hoping the recent selling had come to an end. Over the final few hours, the shift was again to safer areas of our market. Check out the chart:
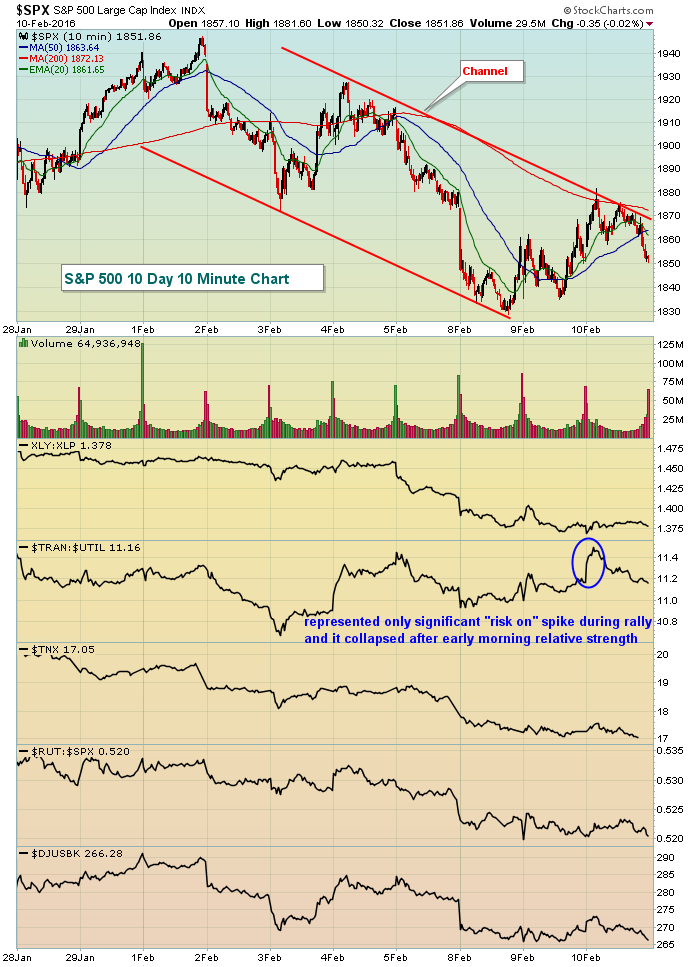 The downtrend lives on and money continues to rotate away from aggressive sectors and industry groups. The transports vs. utilities had shown a little life but with the 10 year treasury yield ($TNX) falling again, that relative strength in transports quickly subsided. So despite the S&P 500's attempt the past few days to seek a bottom and rally, the rotation of money is not supporting that notion.
Among industry groups, the Broadcasting & Entertainment index ($DJUSBC) had a particularly rough day and is being featured below in the Sector/Industry Watch section.
Pre-Market Action
It's a gloomy start to the trading day. Markets in China and Japan were closed overnight, but the Hang Seng ($HSI) reopened from its Lunar New Year holiday and promptly fell 3.85%. U.S. crude oil was down 3.2% and nearing 2003 lows. While lower crude oil might be seen as great for the economy as prices plummet at the pump, it's actually a sign of weak global demand. Unfortunately, we save pennies in gas stations while we lose thousands in investment portfolios. There are two sides of the trade, however, and being long isn't the only choice.
European markets are under pressure this morning with the London FTSE ($FTSE) and German DAX ($DAX) both down 2% or so. The French CAC ($CAC) is making the breakdown I referred to yesterday as it's lost 4000 price support and is currently down 3.36%.
At last check, U.S. futures are down sharply with the S&P 500 looking to open down as much as 30 points to challenge the lows established in October 2014 and again on January 20th when the SPX hit 1812 on an intraday basis.
Current Outlook
The flight to safety is quite evident and this, unfortunately, is rarely good for equity investors. There are those who are questioning the Fed's credibility and I'm among them. Waiting to see how the global financial market turmoil unfolds is not exactly a comforting action on the part of the Fed. One huge problem is that global markets are breaking down in tandem, which is only accelerating the selling. We're seeing the effects of that overnight with the Hang Seng ($HSI) dropping nearly 4% to close within 3 points of its January 21 low close. Currently, the French CAC ($CAC) is hitting lows not seen since October 2014. Given the current state of U.S. futures this morning, the S&P 500 ($SPX) will be doing the same.
Money is rotating heavily toward treasuries with yields tumbling. The 10 year treasury yield ($TNX) is the one I watch closest as it's closely tied to mortgage rates. Check out where we stand this morning after the 1.65% support level failed to hold:
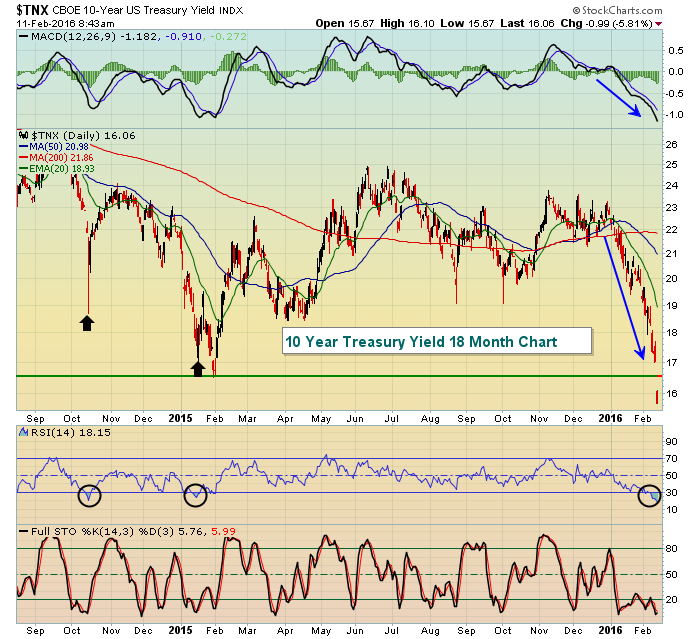 The severe rotation to safety the past 60-90 days has been extremely swift and suggests more selling in equities. The TNX tends to lead equity prices by the nose so this morning's breakdown is not something I would ignore.
Sector/Industry Watch
Walt Disney (DIS) disappointed investors with its latest quarterly results and the effect on the entire industry group ($DJUSBC) can be illustrated below:
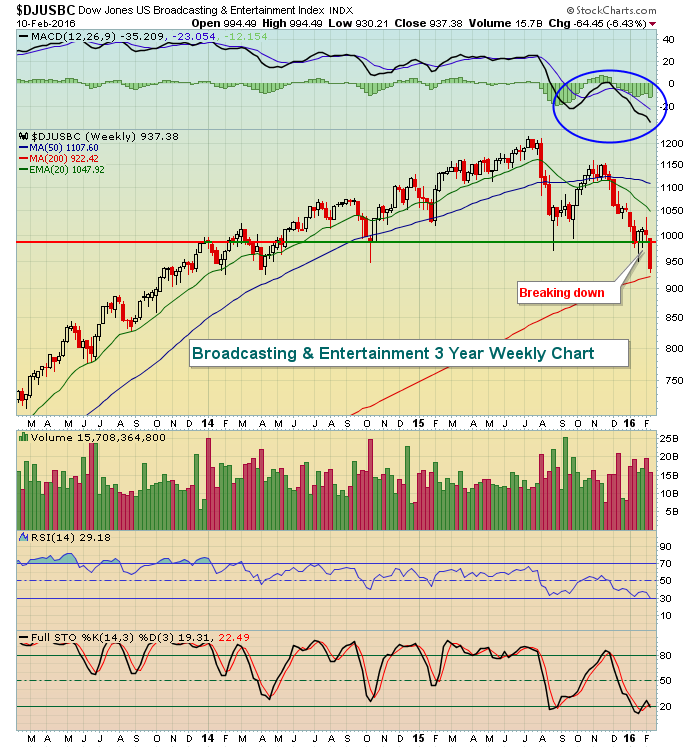 Perhaps the only technical positive above is the fact that the DJUSBC is approaching oversold territory. But oversold can remain oversold for awhile. Personally, I'd expect more selling in the group in the near-term.
Historical Tendencies
Let's not forget the January Effect. Since 1950, the S&P 500 has only seen 7 January's that produced worse results than January 2016. That poor January performance typically precedes poor performance during the balance of the year. We're certainly seeing that here in February thus far.
Key Earnings Reports
(actual vs. estimate):
AAP: 1.22 vs 1.21
BWA: .75 vs .72
K: .79 vs .75
MFC: .31 vs .31
NLSN: .80 vs .76
NOK: .17 vs .13
PEP: 1.06 vs 1.06
RAI: .48 vs .50
SON: .64 vs .63
TRIP: .36 vs .25
(reports after close, estimate provided):
AIG: (.86)
ATVI: .83
CBS: .91
FEYE: (.76)
WYNN: .74
Key Economic Reports
Initial jobless claims released at 8:30am EST: 269,000 (actual) vs. 281,000 (estimate)
Happy trading!
Tom
