Market Recap for Thursday, April 28, 2016
U.S. indices tumbled on Thursday, the day after central bankers temporarily closed the candy store. Neither the Federal Reserve here in the U.S. nor Bank of Japan offered up any stimulus that traders could wrap their arms around and amid signs of slowing momentum decided to move to the sidelines.
Energy (XLE), the strongest sector of late, saw profit taking as the XLE was the worst performing sector ETF, dropping 1.49%. The strongest sectors included consumer staples (XLP) and utilities (XLU), which showed a daily return of .10% and (.15%), respectively. The flight to safety has also been apparent with money flowing into treasuries since the FOMC announcement on Wednesday.
Perhaps most important has been the rise in the Volatility Index ($VIX), which hit support and is trending higher. Here's the latest view on the VIX:
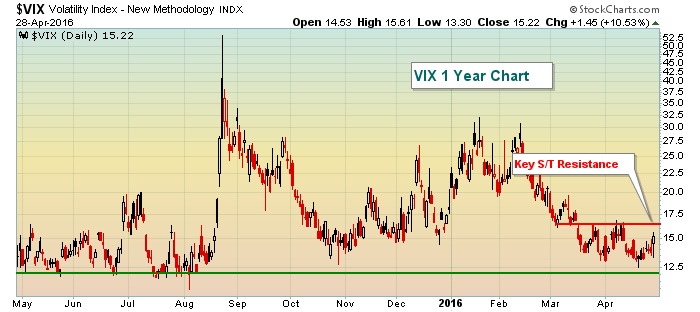 A breakout above 16.50-17.00 would indicate that the next level of fear has arrived and could certainly benefit the bears and help to spur additional selling of U.S. equities.
Pre-Market Action
The Tokyo Nikkei index ($NIKK) was closed for a holiday so we haven't seen the "next day" after the 3.61% decline that followed the Bank of Japan's decision to hold rates steady. The Hang Seng ($HSI) fell 1.5% overnight, however, while China's Shanghai Composite ($SSEC) was down marginally. In Europe, the German DAX enjoyed a very bullish bounce off its now-rising 20 day EMA as you can see below:
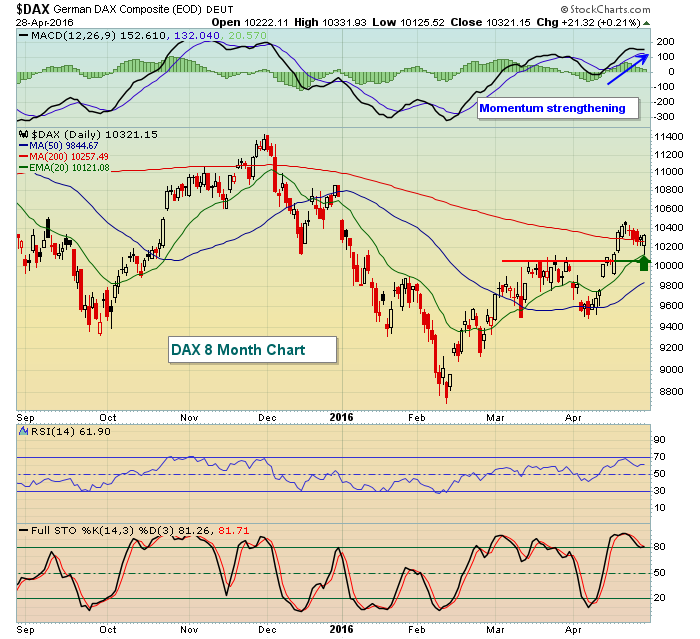 So long as the DAX holds onto price support just above 10000, especially if it continues bouncing off rising 20 day EMA support, then action in Germany remains bullish. Given the tight positive correlation between the DAX and the S&P 500, this would be good news for U.S. equities. The DAX is down 1.3% this morning at last check, but remains 60 points or so above its 20 day EMA.
U.S. futures are also pointing lower despite solid earnings news after the bell on Thursday. Amazon.com (AMZN) and LinkedIn (LNKD) are up nicely following solid quarterly earnings reports. AMZN is featured below in the Sector/Industry Watch section below.
Current Outlook
Today will be an important day for the U.S. stock market technically. The biggest issue throughout April has been the negative divergences that have printed across most of our major indices, sectors and industry groups. On Friday, the Dow Jones not only suffered its first 200 point drop since the day it set its recent closing low on February 11th, but it closed beneath its rising 20 day EMA with a negative divergence in play. It's not unusual to see selling accelerate down to test the 50 day SMA after such an occurrence. Therefore, we're likely to see better opportunities for entry on the long side as the 50 day SMA is currently at 17396, another 434 points below Thursday's close. Here's the current look on the Dow Jones:
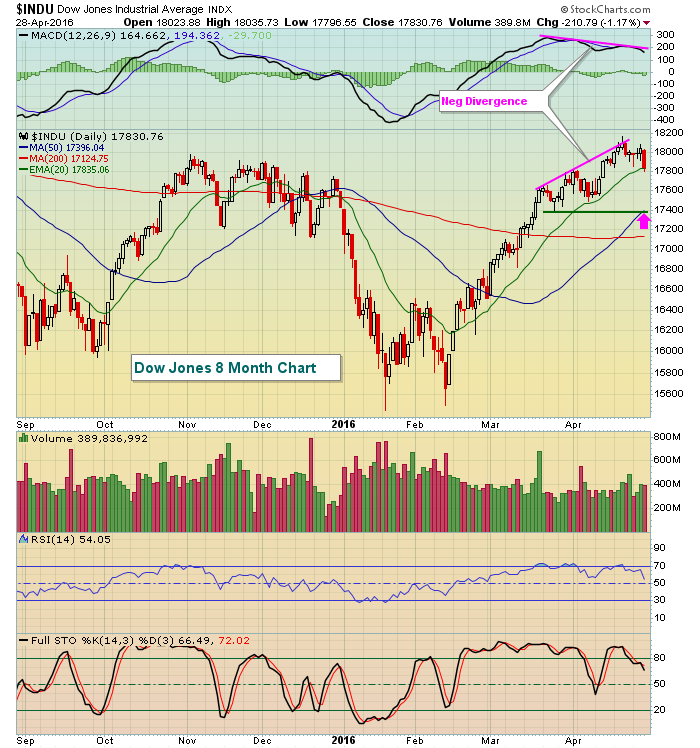 The pink arrow highlights the potential target after the Dow Jones' first close beneath its 20 day EMA since this rally began in mid-February.
Sector/Industry Watch
Amazon.com (AMZN) is up 12% in pre-market action after posting blowout results on Thursday after the bell. AMZN is a key component of the Dow Jones U.S. Broadline Retailers index ($DJUSRB). Broadline retailers have been flat over the past three months and rank as one of the worst performing groups within the consumer discretionary sector (XLY) over that period. They rank ahead of only footwear ($DJUSFT) and business training & employment agencies ($DJUSBE) over the past three months. While AMZN will most certainly provide a short-term boost to DJUSRB 2016 performance, AMZN will likely have issues with overhead price resistance as reflected below:
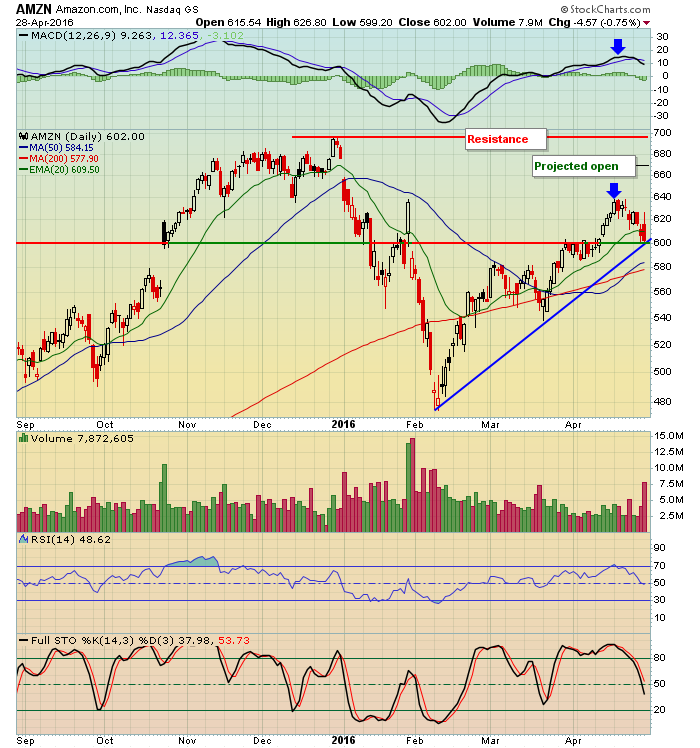 There are several positives here. First, AMZN has been in a very nice uptrend since its February bottom. Next, trendline support is holding. Third, the blue arrows show that as AMZN hit its most recent price high, it was also setting a new high in its MACD. So momentum remains quite strong. But the issue will clearly be overhead price resistance. Given that the 600 area has been a key pivot level in the past, I'd view AMZN to be in a 600-695 trading range for now. I'd be a seller in the upper 600s until AMZN can make its breakout above 700 on confirming volume.
Historical Tendencies
Expanding on the AMZN chart above, let's consider seasonality implications. Below is the calendar month performance of AMZN over the past twenty years:
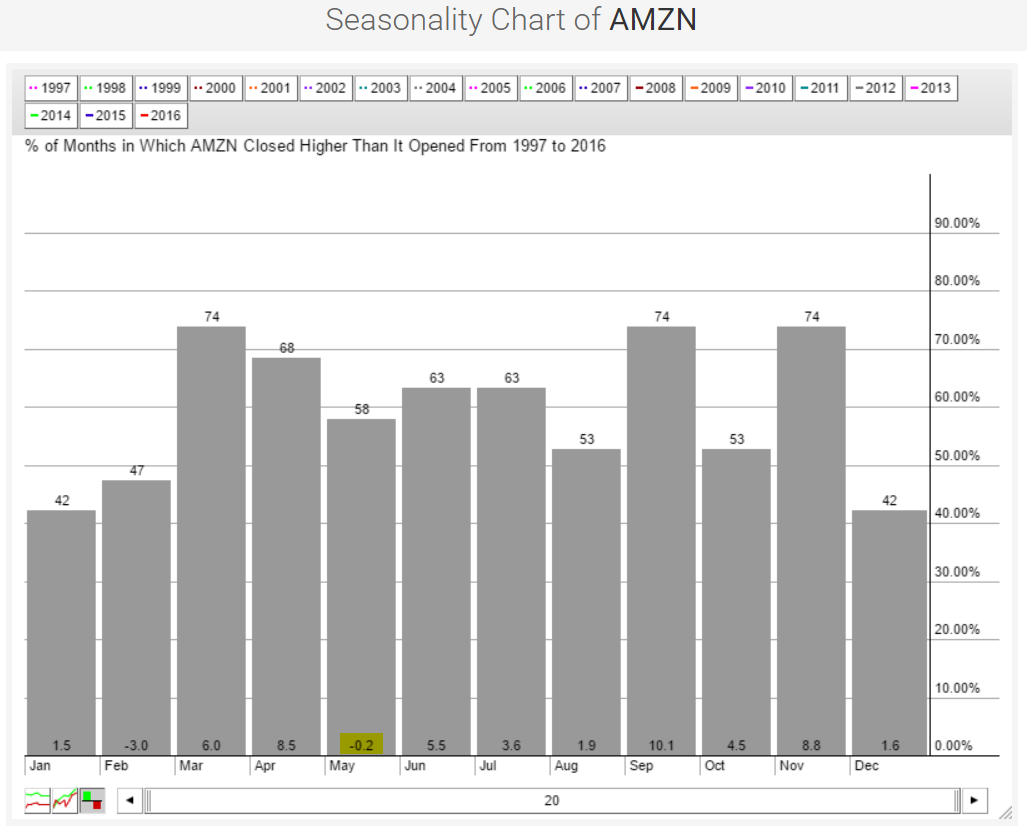 While March, April, June and July all show excellent historical returns and support owning AMZN during those months, May seems to be an exception. This could be another reason to consider taking profits and awaiting a better re-entry point.
Key Earnings Reports
(actual vs. estimate):
CVX: vs (.18) - have not seen actual results yet
LM: (.15) vs .13
MNST: vs .75 - have not seen actual results yet
PSX: .67 vs .86
STX: .22 vs .42
XOM: .43 vs .28
Key Economic Reports
March personal income released at 8:30am EST: +0.4% (actual) vs. +0.3% (estimate)
March personal spending released at 8:30am EST: +0.1% (actual) vs. +0.2% (estimate)
Q1 employment cost index released at 8:30am EST: +0.6% (actual) vs. +0.6% (estimate)
April Chicago PMI to be released at 9:45am EST: 53.4 (estimate)
April consumer sentiment to be released at 10:00am EST: 90.4 (estimate)
Happy trading!
Tom
