Market Recap for Tuesday, June 28, 2016
Much technical damage has been inflicted over the past few trading days. So the obvious question is "how long might this current rally last?" We cleared the first technical hurdle when the S&P 500 yesterday closed back above 2025 and its declining 20 hour EMA. Here's a quick view of that success:
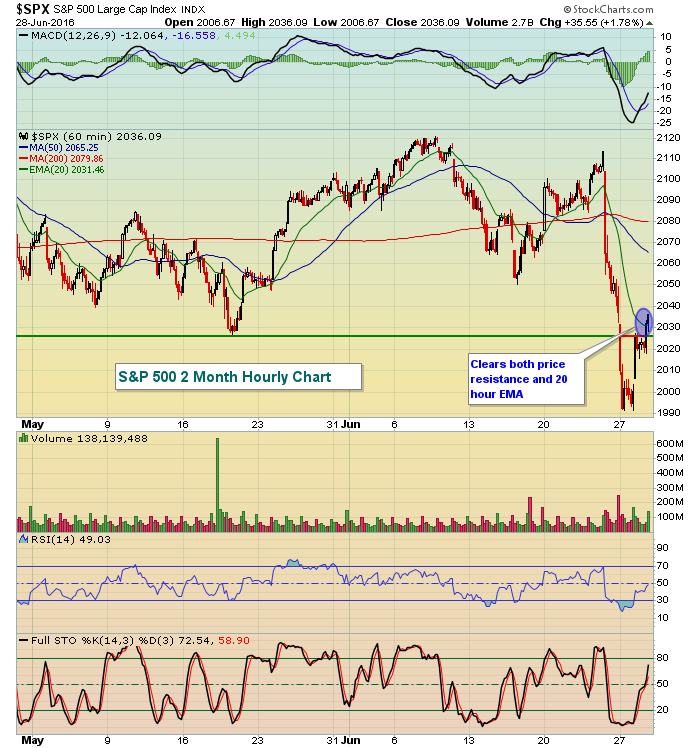 While this isn't a major milestone, it does provide the bulls a bit more ammunition to carry this rally further. Failure at 2025-2030 would have set up another impulsive drop. The Volatility Index ($VIX) fell more than 21% yesterday and has quickly fallen from the high of 26.72 set on Monday.
Crude oil ($WTIC) rallied $1.50 per barrel on Tuesday to climb back above $49 and that set the stage for a rally in energy shares (XLE, +2.78%). Energy has been the leading sector in 2016 so it was important to see leadership from that group during yesterday's rally. Should we see a continuing market rally, energy is likely to remain the leader.
Financials (XLF, +2.56%) also rallied hard on Tuesday after being clobbered during the Brexit related decline. The XLF is among the worst performing sectors over the past week and its 7.11% drop over the past month ranks it at the bottom of the sector leaderboard. Banks ($DJUSBK) have been one of the reasons for the poor performance of financials, but they rallied strongly on Tuesday to lead the group. While it's encouraging to see that strength and leadership, for now it appears to be nothing more than a dead cat bounce. Check out the chart:
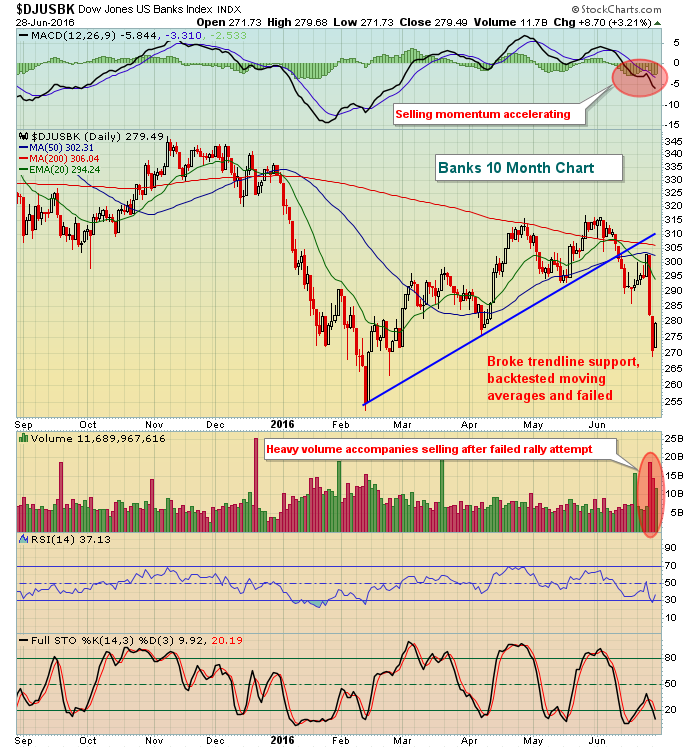 The declining 20 day EMA, currently at 294, should provide a key level of resistance where the bears will try to inflict more technical damage. Respect that level on a further bounce.
Pre-Market Action
Global markets are continuing the rally they enjoyed on Tuesday. Asian markets rallied overnight with the Tokyo Nikkei ($NIKK) leading the way with a 1.59% spike. European markets also continue to recover from its recent Brexit losses with the German DAX moving back above 9500, a key short-term price resistance level. Its falling 20 day EMA resides at 9822 and will come into play if the DAX can hang on and close above 9500, especially 9557 (June 24th reaction high close after Brexit).
Pending home sales will be released later this morning and could contribute to volatility in the housing area.
Current Outlook
There are a number of ways to determine the potential duration of a short-term rally. The most obvious is price and moving average resistance. Clearing 2030 on the S&P 500 was an important first step to lengthen the rally. The 20 day EMA will pose a big threat as the recent selling was impulsive and occurred on very heavy volume. That normally suggests the beginning of a more pronounced downtrend with the falling 20 day EMA serving as key resistance. The 20 day EMA is currently residing at 2071.
In addition to price and moving average resistance, I like to see where the money flows during rally attempts. If the S&P 500 can rally with relative strength in aggressive areas, there's a better chance of a continuing rally. But if money is rotating towards safety during a rally, then caution becomes very important. Here are a few different signals I'd watch:
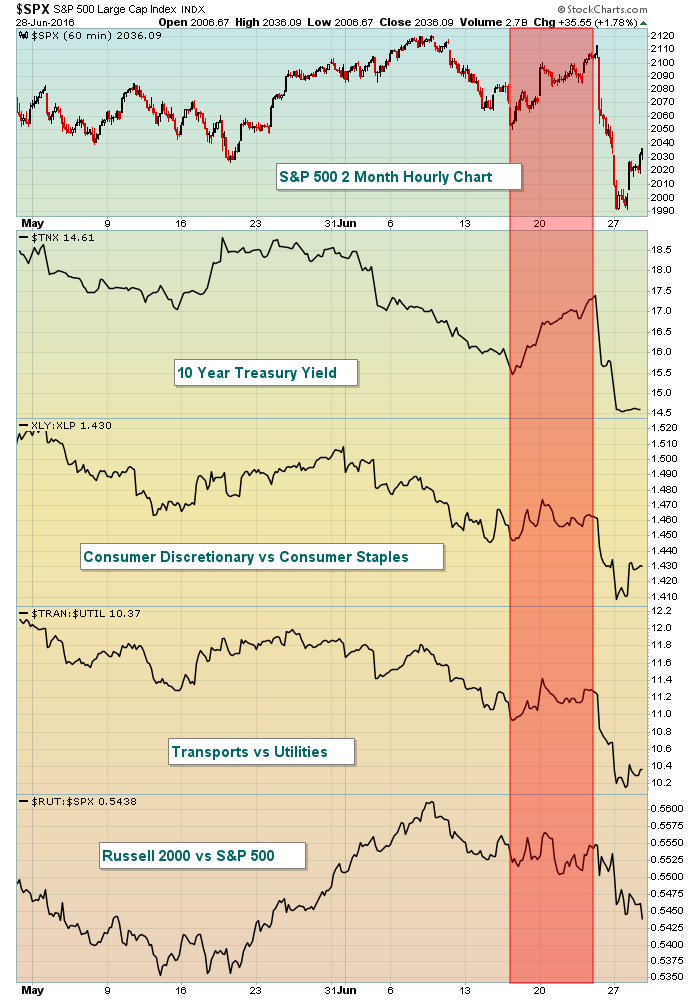 A healthy rally occurs with the S&P 500 moving higher and supported by rising lines among the TNX, XLY:XLP, TRAN:UTIL and RUT:SPX. Note the red shaded area above. The S&P 500 rallied to near previous highs, but the "signals" were left in the dust with little rally in these "below the surface" signals. That was a problem, along with the increasing expected volatility. If you're bullish and on the long side, you want to see a continuing rally with these "signal" lines rising rapidly as well.
Sector/Industry Watch
Coal ($DJUSCL) jumped more than 11% on Tuesday and is now consolidating in a wide trading range between 32 and 40, as reflected below:
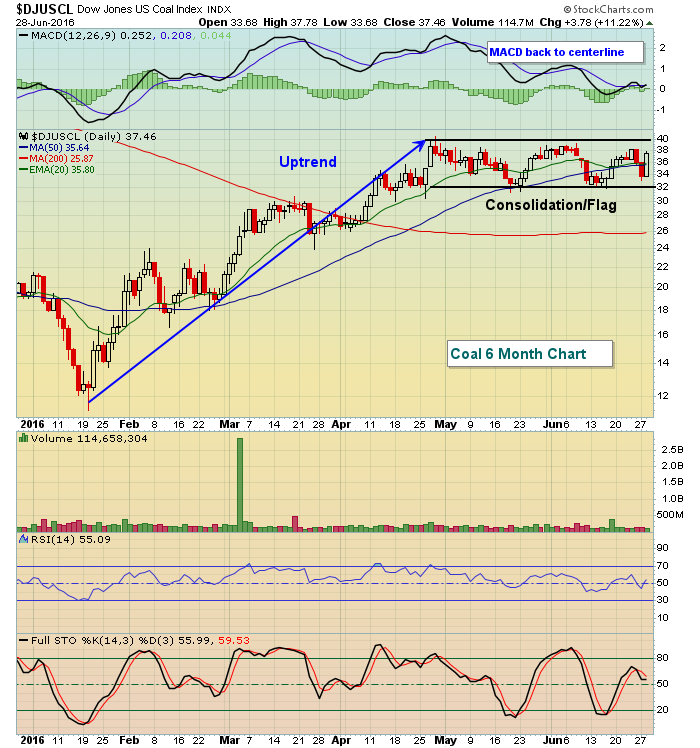 The move off the February lows has been very impressive and now coal seems to be consolidating, awaiting its next breakout. A close above 40 would likely suggest the next rally is underway.
Historical Tendencies
The end of calendar months tend to be very strong as market makers, portfolio/hedge fund managers, etc. look to add positions ahead of monthly inflows at the start of calendar months. For instance, on the S&P 500, the following annualized returns have been produced on the 29th (today), 30th (tomorrow) and 31st (no 31st day in June unfortunately):
29th day of all calendar months: +19.50%
30th day of all calendar months: +12.00%
31st day of all calendar months: +31.20%
Earnings Reports
(actual vs. estimate):
AYI: 2.06 vs 1.97
GIS: .66 vs .60
MON: 2.17 vs 2.41
Economic Reports
May personal income released at 8:30am EST: +0.2% (actual) vs. +0.3% (estimate)
May personal spending released at 8:30am EST: +0.4% (actual) vs. +0.4% (estimate)
May pending home sales to be released at 10:00am EST: -1.0% (estimate)
Happy trading!
Tom
