Market Recap for Monday, July 18, 2016
The action on Monday was led by the NASDAQ's 0.52% gain with technology (XLK, +0.67%) pacing the advance. One bullish piece of technical news within the technology space was the breakout of internet stocks ($DJUSNS), which gained 2.0% on the session, clearing 1100 resistance after trading at or above 1090 on 30 occasions since November 2015. That's key as many of the stocks within this industry like Facebook (FB) and Alphabet (GOOGL) are considered leaders among U.S. stocks. Both FB and GOOGL enjoyed nice days on increasing volume. Here's the chart on the DJUSNS to visualize the breakout:
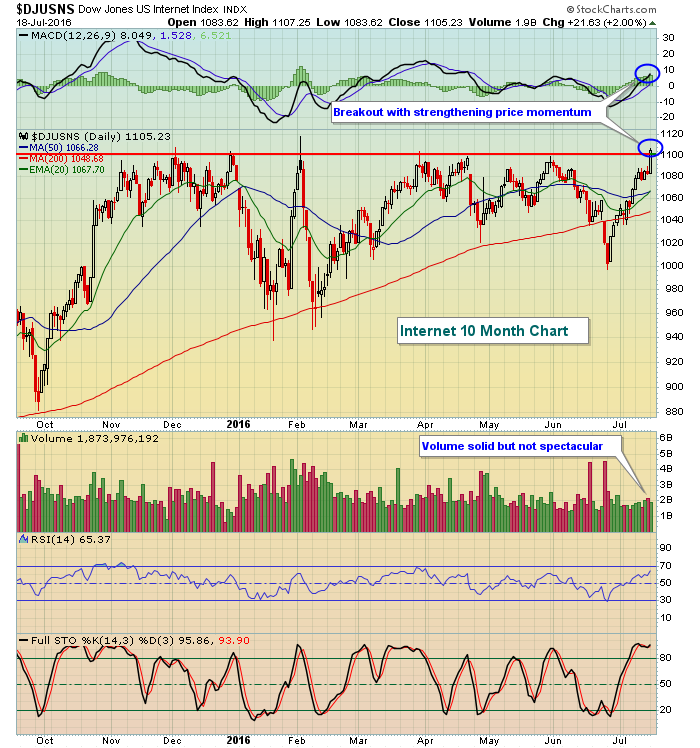 The lack of big volume is a bit disconcerting, but keep in mind that the industry group didn't break out until the afternoon session and that's when I look for the pick up in volume. So today's reaction to the breakout will be important. We want to see follow through.
Gold mining shares ($DJUSPM) gained 0.82% yesterday to lead the materials sector (XLB, +0.66%) to strong gains as well. The big problem with gold and gold-related stocks is that the U.S. Dollar index ($USD) remains in a very bullish bull flag pattern and a breakout will present significant headwinds for the group. Here's the dollar's current technical view:
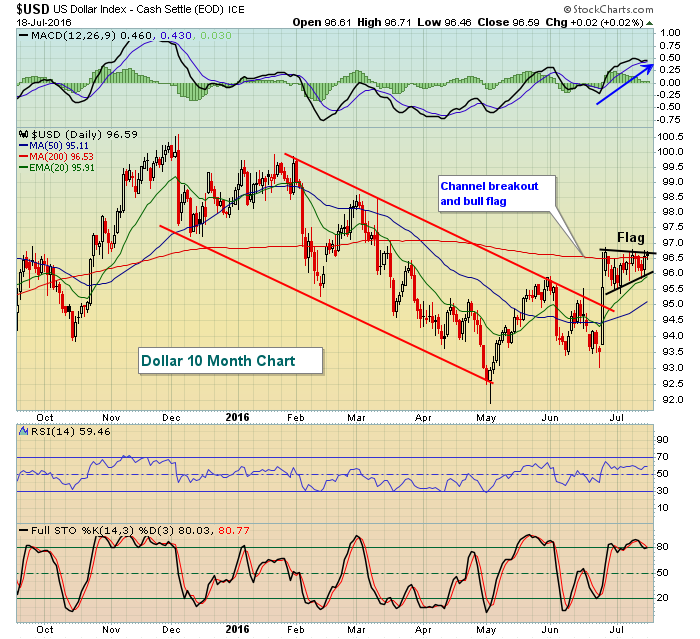 The down channel has been broken, a bull flag has emerged and the daily MACD shows strengthening price momentum - a powerful combination. Gold (GLD) has been a great place to be over the past several months, but with the dollar regaining earlier strength, GLD could suffer on further technical strength in the dollar.
Pre-Market Action
Global markets experienced mostly fractional losses overnight in Asia and this morning in Europe. The U.S. is following suit with the Dow Jones futures down a mere two points. The S&P 500 and NASDAQ both are showing slightly worse futures, but still very well contained given the extent of the recent rally.
Housing data this morning was slightly better than expected, while quarterly earnings have been mixed both last night and this morning. Netflix (NFLX) is being hit particularly hard, down 13% after disappointing traders.
The 10 year treasury yield ($TNX) is down slightly at 1.57% this morning, but as long as it can hold its now-rising 20 day EMA (currently at 1.53%), that should be good for equity prices.
Current Outlook
The ratio of consumer discretionary to consumer staples stocks (XLY:XLP) has been under pressure since setting a high in November 2015. The recent relative strength in the XLY, however, has taken the ratio up to challenge its declining 20 day EMA after printing a double bottom at 1.35. If the 2016 rally is to continue and the seven year bull market extends, we'll likely need to see continuing relative strength here. The trend in this ratio tells us if traders are willing to take the risks necessary to drive equity prices higher, a common ingredient during nearly every bull market rally. A rising trend supports higher equity prices while a declining trend suggests the contrary. Check out the current view, compared to performance of the S&P 500:
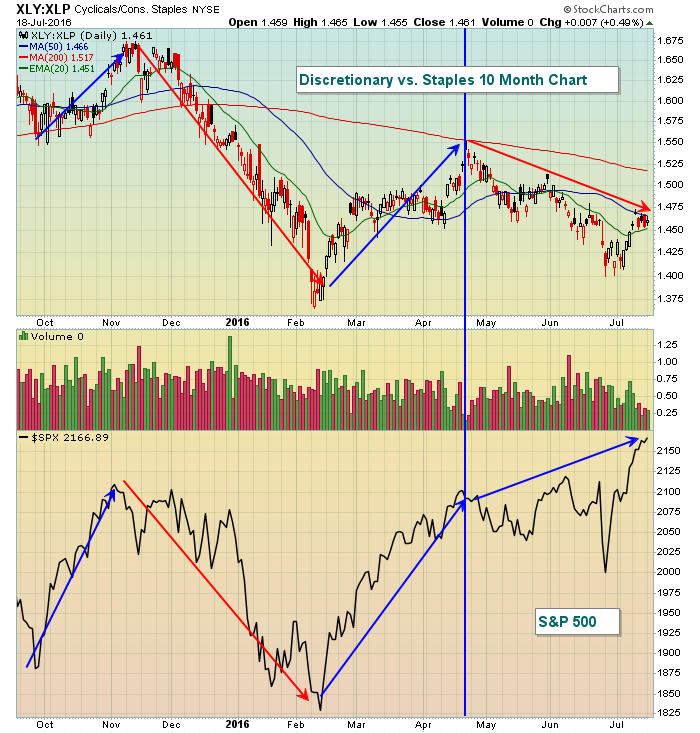 Check out that divergence in relative performance since April. The S&P 500 has managed to climb to all-time highs while money has rotated significantly from consumer discretionary (aggressive money) to consumer staples (defensive money). This needs to change to feel more confident about the sustainability of this rally.
Sector/Industry Watch
Energy (XLE) has neared another breakout while crude oil ($WTIC) is well off its earlier highs. Something will likely have to give soon. Check out the recent divergence here:
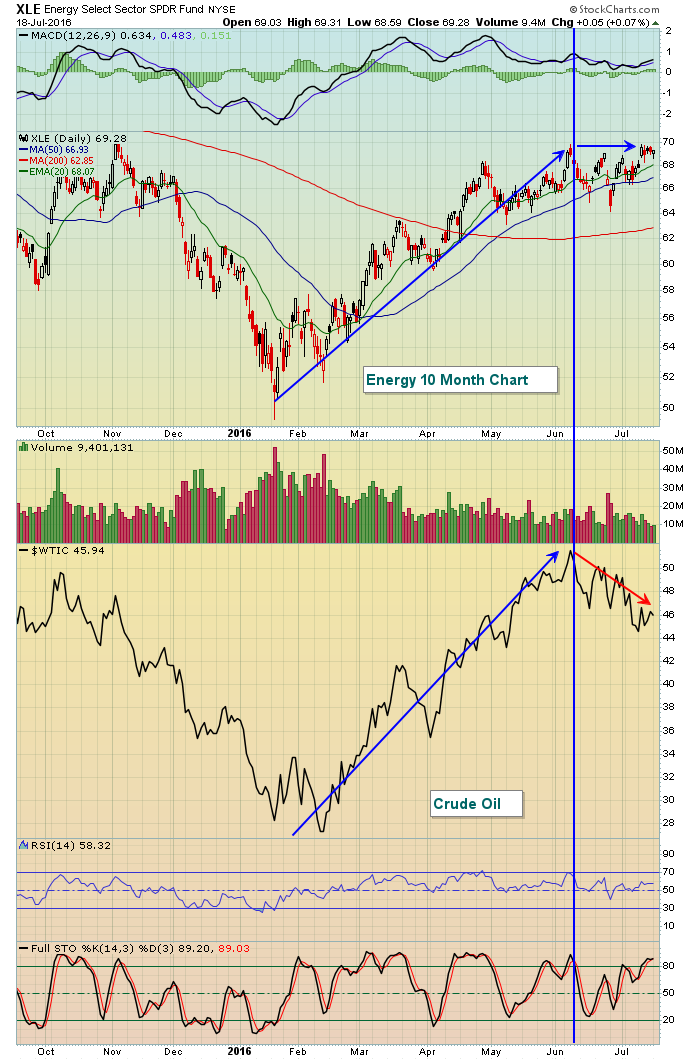 I suspect this divergence will be resolved with another push higher in crude oil and a corresponding breakout to fresh highs in the XLE.
Historical Tendencies
The Russell 2000 is in the midst of one of its worst historical periods of the year. Here are the annualized returns for each calendar day of the current bearish period since 1987:
July 18 (yesterday): -64.69%
July 19 (today): +0.79%
July 20 (tomorrow): -15.04%
July 21 (Thursday): -157.89%
July 22 (Friday): +66.78%
In addition to the above, July 23rd (Saturday) and July 24th (Sunday) sport annualized returns of -120.84% and -90.32%, respectively. Fortunately for the bulls, the market won't be open those two days. So despite the historical gains realized on July 22nd, this week has very negative consequences historically.
Key Earnings Reports
(actual vs. estimate):
GS: 3.72 vs 3.01
JNJ: 1.74 vs 1.67
LMT: 3.32 vs 2.92
PM: 1.15 vs 1.21
RF: .20 vs .20
UNH: 1.96 vs 1.89
(reports after close, estimate provided):
DFS: 1.42
ISRG: 4.21
MSFT: .58
UAL: 2.53
Key Economic Reports
June housing starts released at 8:30am EST: 1,189,000 (actual) vs. 1,170,000 (estimate)
June building permits released at 8:30am EST: 1,153,000 (actual) vs. 1,150,000 (estimate)
Happy trading!
Tom
