Market Recap for Tuesday, August 23, 2016
While U.S. equities continue to waver, albeit in a slow northerly fashion, they're not the only asset groups trying to figure out which direction they want to ultimately go. Yesterday, I discussed the 10 year treasury yield ($TNX) struggling to break out of a six week long consolidation between 1.50% and 1.60%, suggesting that treasury prices are stuck. If you take a look at the U.S. dollar index ($USD), you see a period of consolidation that's lasted since the dollar topped in March 2015. Check out the bigger picture:
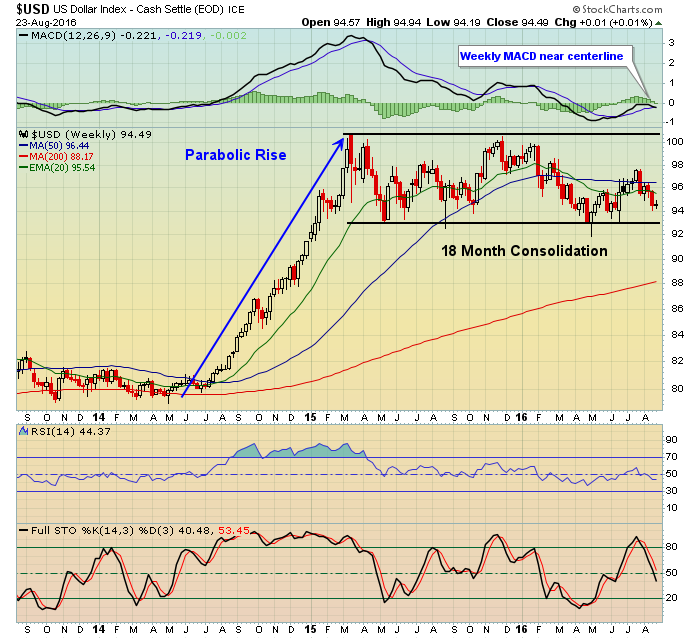 Momentum on this weekly chart is essentially non-existent. Let's break it down further and look at the dollar's daily chart:
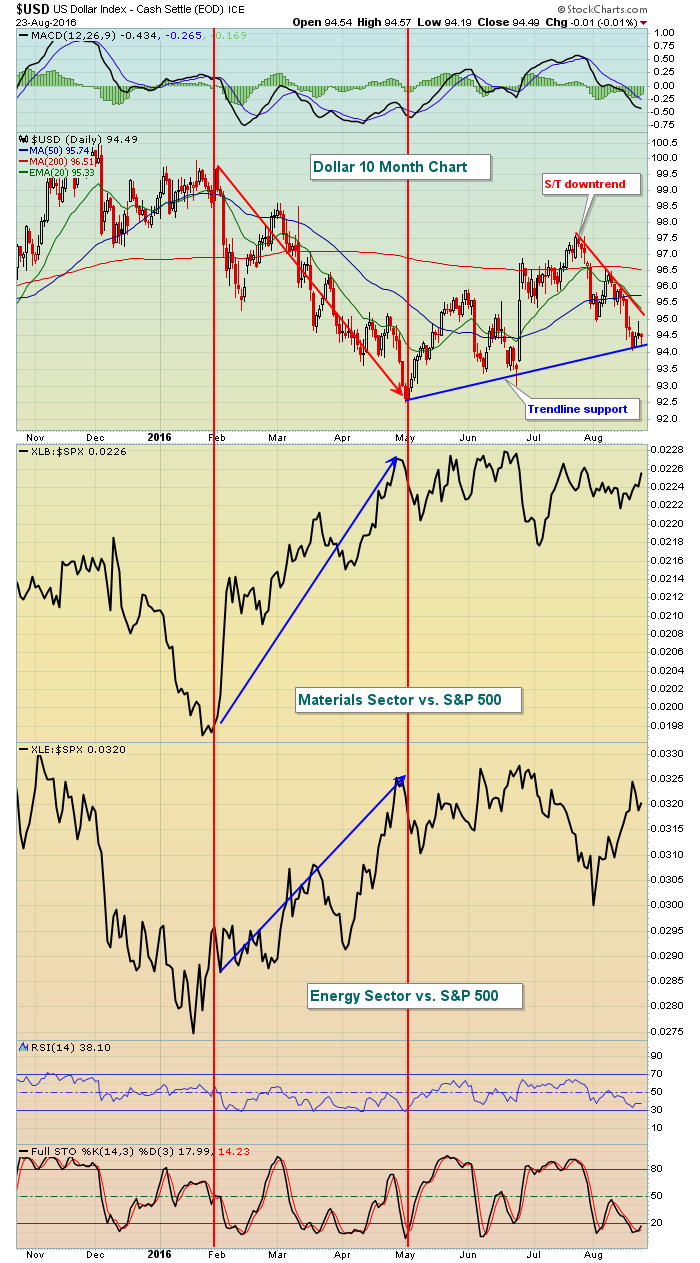 You need to note a few things from this chart. First, it's fairly clear to me that the dollar's weakness beginning in late January helped to fuel relative outperformance in both materials and energy stocks and that's what led the market yesterday with the XLB rising 0.86% and the XLE up 0.70%. If you're bullish materials and energy, then what you'd really like to see is the dollar break down on that earlier longer-term chart where the USD has been holding support near 92-93. On the other hand, should the dollar resume its earlier parabolic rise, there'll be relative headwinds for both the XLB and XLE. The latest decline in the dollar - since late July - has really helped the XLE on both an absolute and relative basis.
Utilities (XLU, -0.44%) and consumer staples (XLP, -0.20%) were both weak on a relative basis yesterday with all remaining sectors mostly rising on a fractional basis. All of our major indices finished with gains for the day, but those gains were pared after a strong start in the opening thirty minutes.
Pre-Market Action
U.S. futures are flat, following the lead of both Asian and European markets, which are/were mixed.
The 10 year treasury yield ($TNX) hasn't changed much over the past few sessions and remains squarely in the middle of its 1.50%-1.60% range.
Earnings reports are slowing, but we will hear the latest from Hewlett-Packard (HPQ) after the bell today. HPQ, like so many indices and stocks, is showing slowing momentum in the form of a negative divergence on its daily MACD. Therefore, don't expect a warm reception to anything less than very solid results.
Current Outlook
Let's look at a two month intraday chart of the NASDAQ 100 ($NDX) for directional clues:
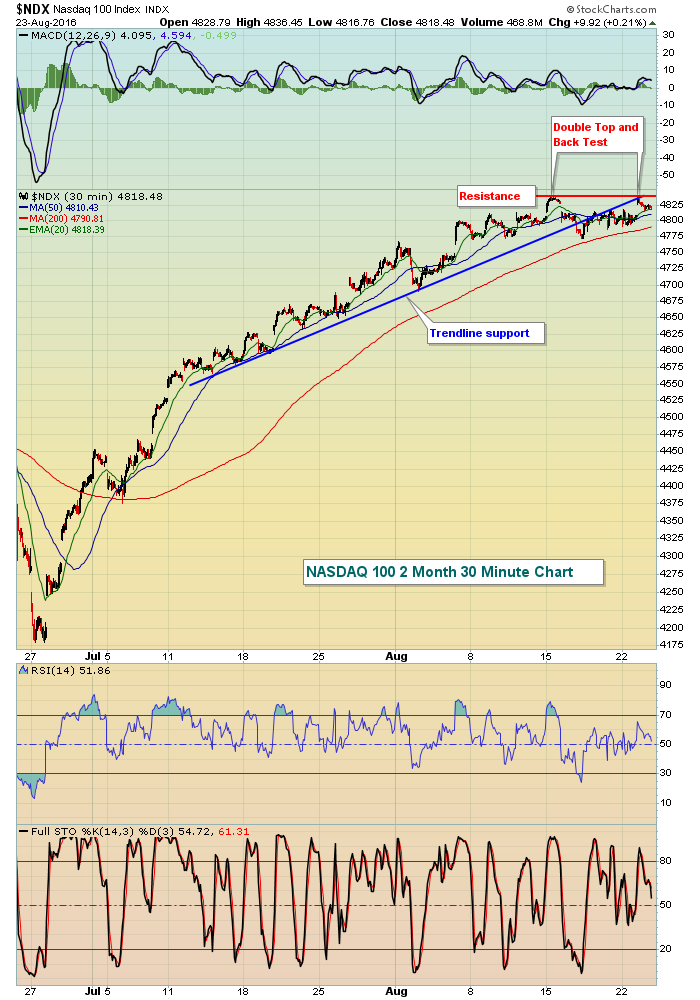 As I look at this chart, I keep a couple of things in mind. First, the weekly chart of the NDX - and all of our major indices - is bullish, at least from a price perspective (MACDs are strong). On the daily charts, however, the NDX and other key indices are flashing momentum issues in terms of MACD negative divergences. So the daily charts are telling us to be careful and to potentially expect 1-3 weeks of weakness or consolidation, possibly more. With that in mind, I see a double top that may have formed yesterday on the NDX. The gap higher and failure is a short-term warning sign that we should respect. If the NDX can climb and clear this price resistance level, then the potential double top is negated, but until then the daily chart is our reminder that we could be in a short-term topping phase. Seasonality will not help as you can see in the "Historical Tendencies" section below.
Sector/Industry Watch
One month ago, on July 22nd, the S&P 500 closed at 2175. Yesterday, it closed at 2186. We've seen a ton of rotation, but the overall benchmark index has barely moved. During this period, one of the industry groups that has performed extremely well is the Dow Jones U.S. Furnishings index ($DJUSFH). It's gained 6.68% and while that doesn't make it the best performing industry group overall, it does make it the best performing group within the consumer discretionary space. The chart is showing slowing momentum, though. Check it out:
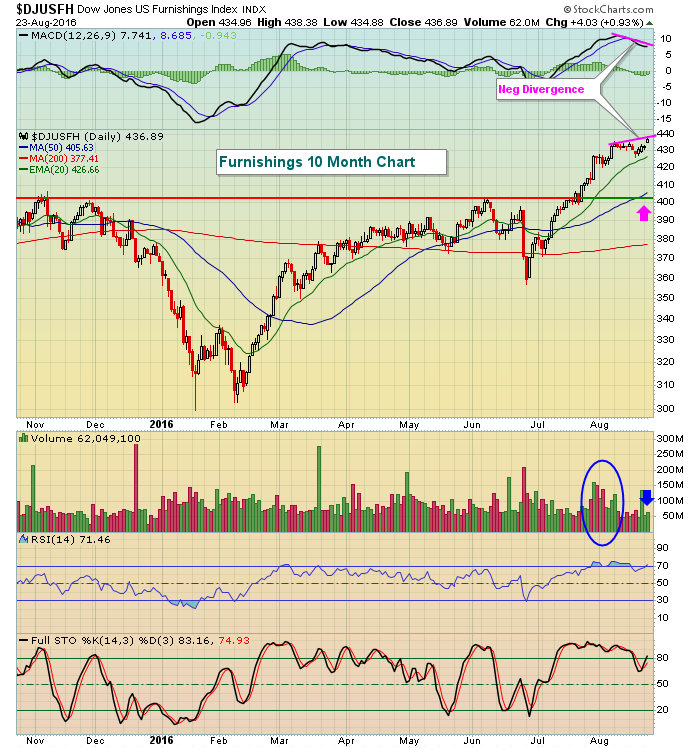 The breakout yesterday is suspicious because there's a negative divergence on the MACD present PLUS check out the light volume on the breakout. Notice how much volume accompanied the earlier price breakout in late July and early August? Well, it vanished on yesterday's breakout so that's a second sign of slowing momentum. The pink arrow marks a potential 50 day SMA test and it's also very close to previous price resistance, now price support. I suspect we'll see money begin to rotate away from this industry group as the slowing momentum weighs.
Historical Tendencies
Here's the history of how the NASDAQ 100 has performed over the past 20 years by calendar month:
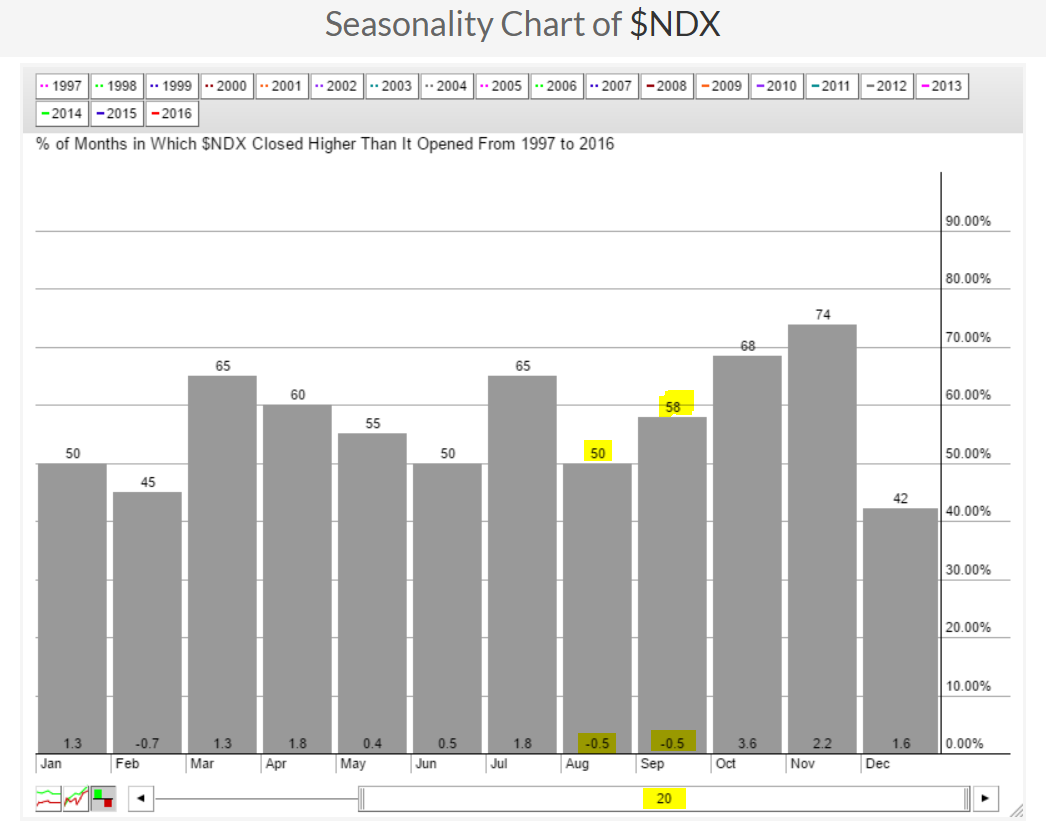 From an average monthly return perspective, it's easy to see that August and September are the two worst performing calendar months and we're still in August so we need to be aware of this tendency. But we also have to realize that August and September have risen 50% and 58% of the time, respectfully, over the past 20 years. So this is not a slam dunk or a guarantee, rather a tendency.
Key Earnings Reports
(actual vs. estimate):
RY: 1.32 vs 1.31
(reports after close, estimate provided):
GES: .06
HPQ: .45
PVH: 1.28
WDAY: (.43)
WSM: .58
Key Economic Reports
June FHFA house price index to be released at 9:00am EST: +0.3% (estimate)
July existing home sales to be released at 10:00am EST: 5,520,000 (estimate)
Happy trading!
Tom
