Market Recap for Wednesday, August 31, 2016
Higher treasury yields in August are impacting more than just a few interest-sensitive equity groups. It's also been driving the U.S. dollar higher. A higher dollar can also affect equities in various ways. Yesterday was a prime example as energy (XLE, -1.58%) and basic materials (XLB, -1.00%) both fell as the dollar ($USD) has capped off one of its strongest one week rallies of 2016. Check out the dollar's advance and subsequent drop in energy and materials:
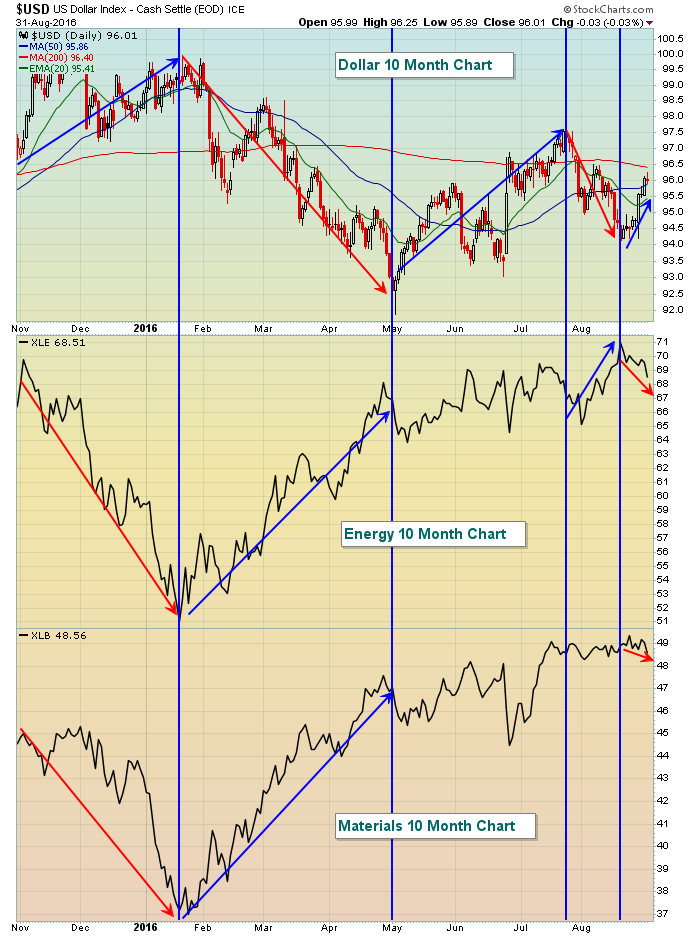 While both the XLE and XLB have moved in unison with the dollar at times, their biggest rises have occurred when the greenback has been in steep declines. The XLE did bounce on its 50 day SMA yesterday as the dollar posted what could be a reversing candle off its uptrend. A short-term trade on the XLE makes sense, but I'd keep a fairly tight stop under the recent low in the event the selling accelerates.
Defensive stocks like utilities (XLU, +0.41%) and consumer staples (XLP, +0.13%) offset losses in many areas of the market. It's noteworthy that financials (XLF, +0.08%) were able to post gains on a day when most sectors fell.
Pre-Market Action
Traders are waiting on the August nonfarm payrolls report, which will be released Friday morning at 8:30am EST. Consensus estimates are calling for 175,000 jobs (179,000 private) and a number at that level or above may be enough to convince the Fed to raise interest rates for a second time later this month. Market participants seem to be prepping for such a Fed move with industry groups that benefit from rising rates moving higher in August. Therefore, tomorrow morning will either confirm those beliefs or abruptly change the direction and rotation within the U.S. stock market. Stay tuned.
This morning, U.S futures are relatively flat while markets around the globe are mixed. Crude oil prices ($WTIC) have fallen another 1% this morning below $45 per barrel after more than a 3.5% decline on Wednesday.
Dow Jones futures are up 8 points with a few minutes to go prior to the opening bell.
Current Outlook
Price action was weak on Wednesday.....until price support was tested and then the bulls' resiliency once again shone through. Both the S&P 500 and the NASDAQ saw its major short-term price support tested and the bulls responded as you might expect during a bull market. Check out both intraday charts:
S&P 500:
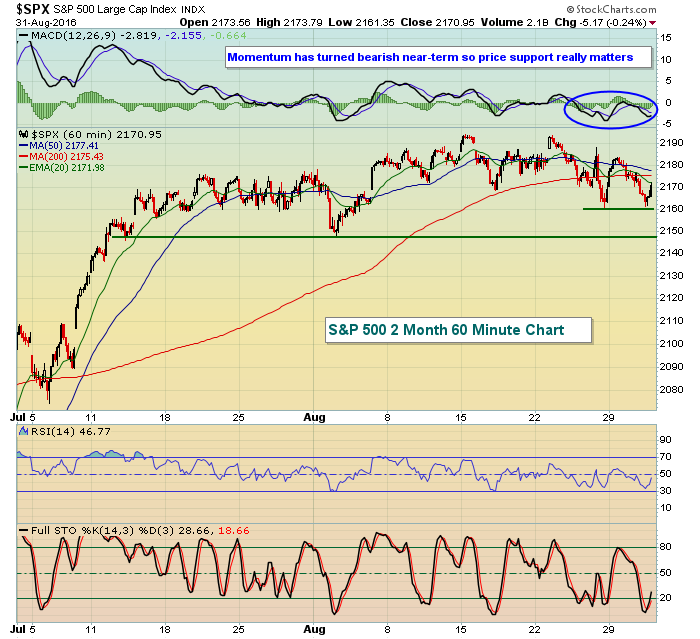 The initial price support is near 2160, then a bigger level is just beneath 2150. Momentum here has turned negative and has remained that way for more than a week so keep a close eye on price support.
Next, a shorter-term chart of the NASDAQ:
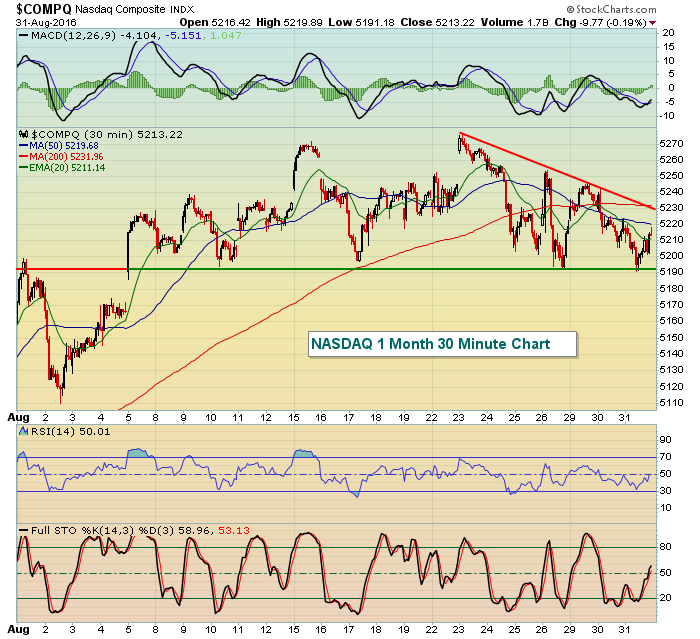 The price support line here is well established at 5190 while the recent downtrend line marks initial resistance near the 5230 level with this "support zone" squeezing every day. It will be interesting to see if the bears can regain control of the action if and when the S&P 500 and NASDAQ lose 2160 and 5190 support, respectively.
Sector/Industry Watch
September has historically been an awful month for the Dow Jones U.S. Tires Index ($DJUSTR) and those historical results are posted below in the Historical Tendencies section. Technically, the DJUSTR could be facing headwinds as well as reflected below on their weekly chart:
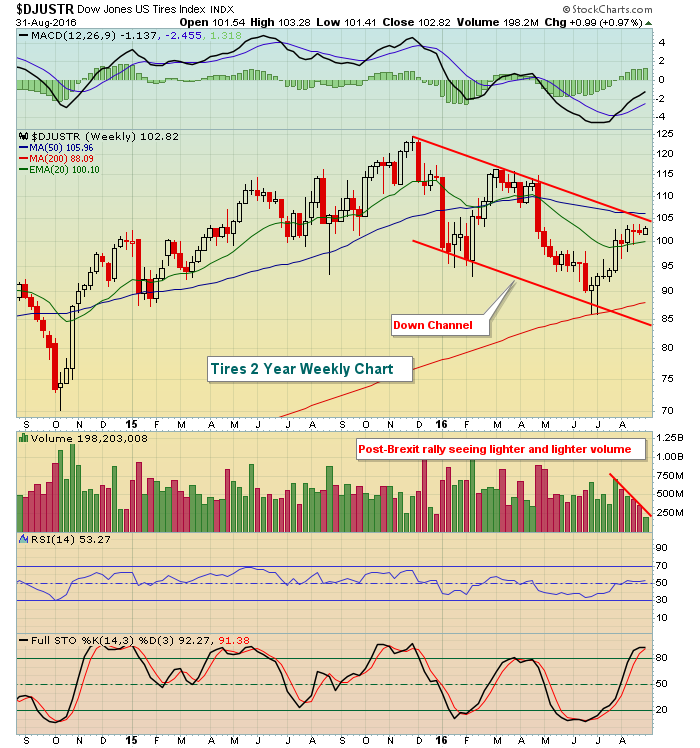 Channel resistance and the 50 day SMA will likely provide a wall of resistance for this group so hedging August profits makes a lot of sense. The short-term upside to 105-106 seems minor compared to the risk of a drop back to the bottom down channel support line.
Historical Tendencies
The DJUSTR averages a loss of 6.5% during the month of September and October experiences negative action as well so it might make sense to avoid this group until November when seasonal tailwinds arrive. Check out the seasonal chart below:
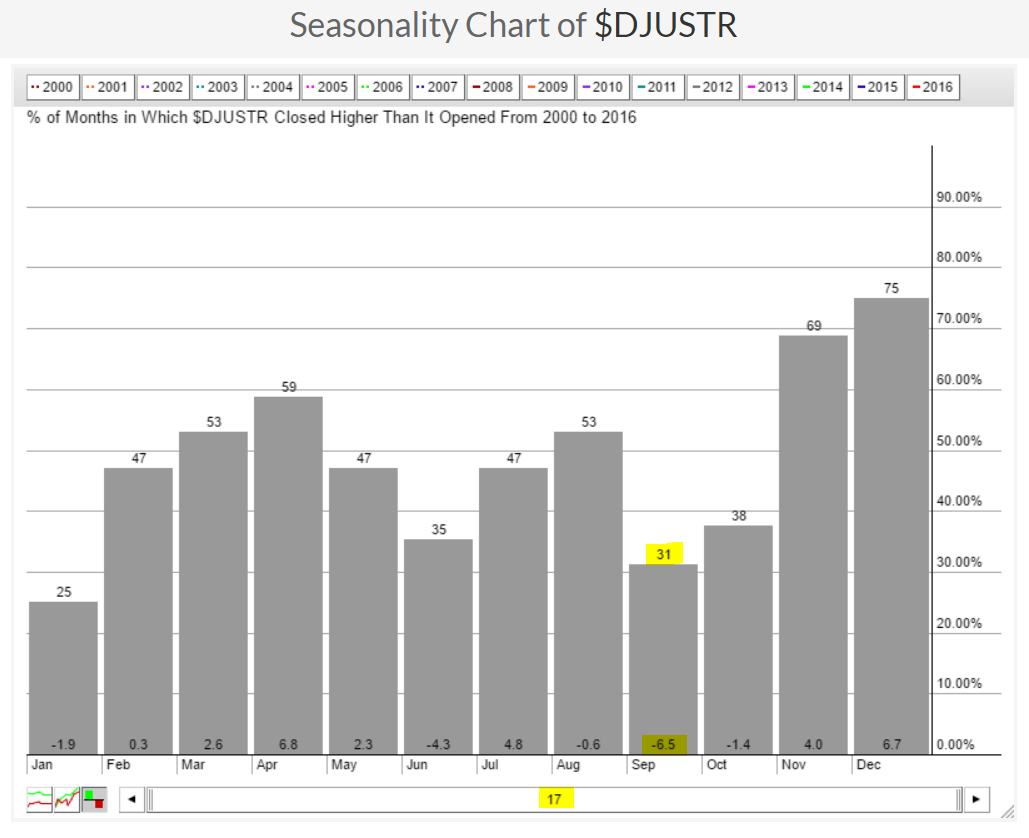 Over the past 17 years, the DJUSTR has risen in just 5 of those years, or 31% of the time. October isn't much better. But look ahead to November and December and it's evident that the tendency has been for tires to get back on the road to close out the year.
Key Earnings Reports
(actual vs. estimate):
CIEN: .35 vs .31
CPB: .46 vs .50
JOY: .10 vs .12
VRA: .17 vs .13
(reports after close, estimate provided):
AMBA: .16
AVGO: 2.29
COO: 2.28
LULU: .38
PAY: .31
SWHC: .53
Key Economic Reports
Initial jobless claims released at 8:30am EST: 263,000 (actual) vs. 265,000 (estimate)
Q2 productivity released at 8:30am EST: -0.6% (actual) vs. -0.6% (estimate)
August ISM manufacturing index to be released at 10:00am EST: 52.2 (estimate)
July construction spending to be released at 10:00am EST: +0.6% (estimate)
Happy trading!
Tom
