Market Recap for Tuesday, September 6, 2016
Energy (XLE, +1.51%) was the clear leader on Tuesday, resuming their leadership role in 2016. Utilities (XLU, +1.09%) also continued its recent climb off price support near 49.00, actually closing above its declining 20 day EMA for the first time in over a month. That has coincided with a sudden break of trendline support on the 10 year treasury yield ($TNX). You can check out the breakout on the XLU, coupled with the breakdown on the TNX in the Current Outlook section below. Energy was the primary benefactor on Tuesday, however, and it's clear which industry group has been leading this charge. Take a look:
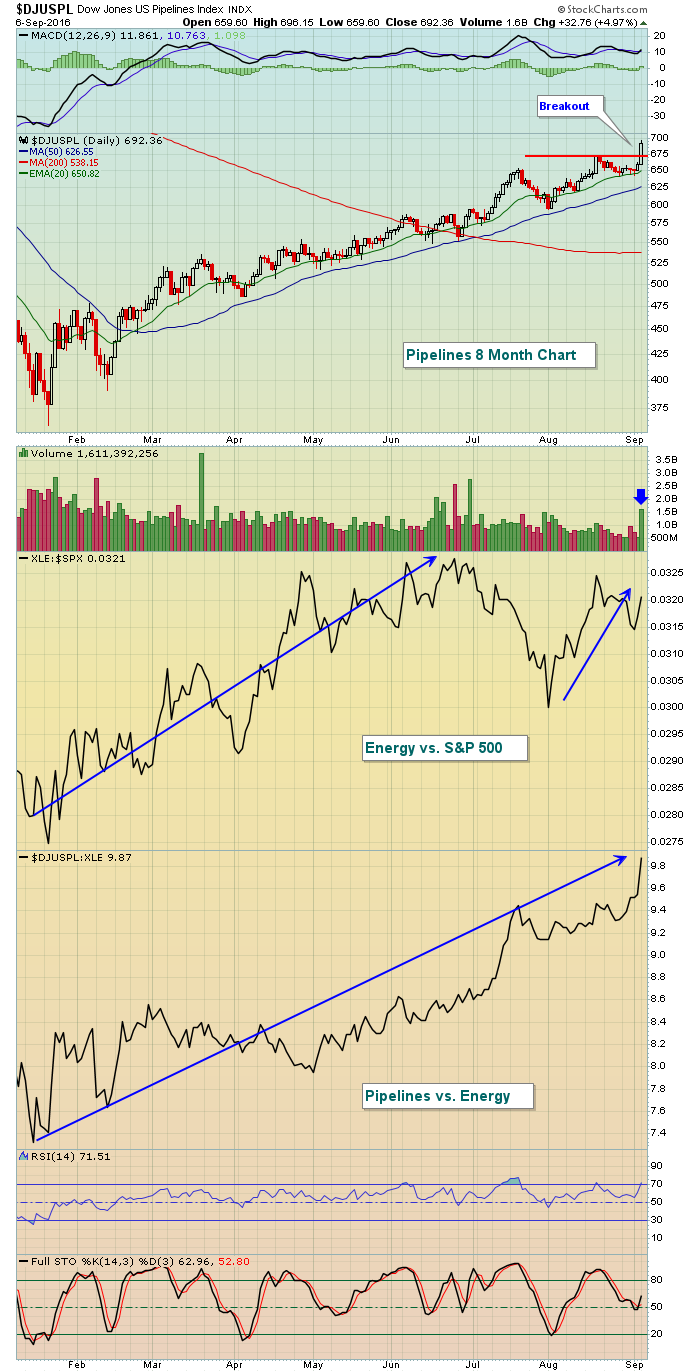 Not only is the pipeline index breaking out, but the above chart reflects relative strength in energy vs. the benchmark S&P 500 index. Furthermore, pipelines are performing exceptionally well vs. its energy peers ($DJUSPL:XLE). In my Trading Places LIVE webinar today at 1pm, I'll provide stock leaders within the pipeline industry that you should consider owning. CLICK HERE to register for this webinar.
Technology (XLK, +0.51%) didn't perform nearly as well as this overall 0.51% gain might suggest. Internet stocks ($DJUSNS) were on fire yesterday, rising 1.73% on the session. It's noteworthy because September tends to kick off a significant rise in internet stocks that lasts through year end.
Pre-Market Action
Asian markets saw mostly profit taking overnight, while Europe is advancing once again. The German DAX, French CAC and London FTSE have all been trending higher post-Brexit (since late June). The DAX, in particular, has a very bullish cup with handle pattern in play, bouncing recently off rising 20 day EMA and price support.
The 10 year treasury yield ($TNX) is under pressure, following through on yesterday's big decline. Goldman Sachs' economists reversed their stand on an earlier call for a September rate hike and the bond market action seems to be saying the same thing.
Dow Jones futures, in broken record fashion, are flat this morning as U.S. equities continue to waffle.
Current Outlook
It's not just the U.S. equity market that can't make up its collective mind. The bond market is struggling too. Is our economy strengthening? Is it weakening? Will the Fed raise again this month? In 2016? At all? A picture does paint a thousand words and the following chart of the XLU and the TNX highlight the current confusion:
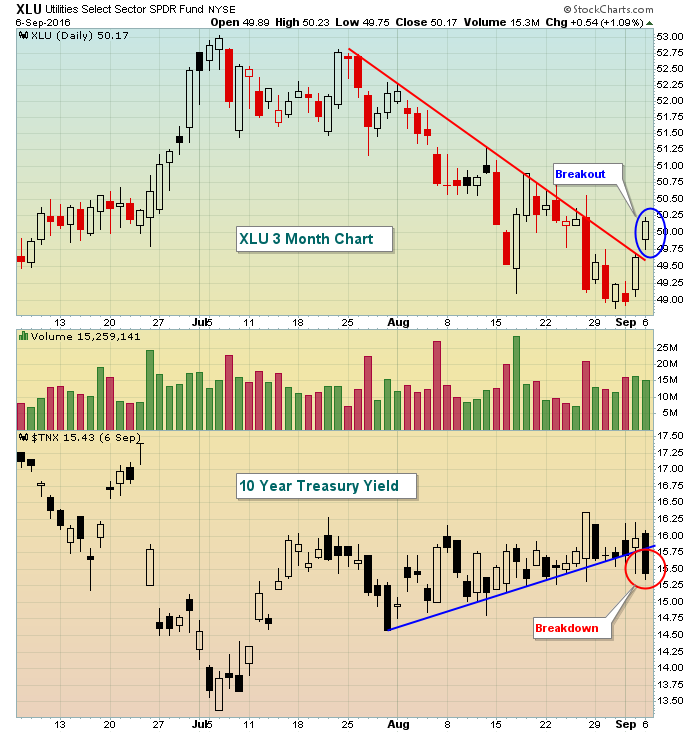 The uptrend in treasury yields was putting tons of pressure on utilities as those stocks' dividends look less attractive as treasury yields rise. Also, rising yields typically precede a strengthening economy and stronger economic activity normally results in rotation away from defensive utilities as money moves into more aggressive sectors where PEs rise quickly.
Sector/Industry Watch
The Dow Jones U.S. Building Materials & Fixtures Index ($DJUSBD) has fallen a little more than 1% over the past week, adding to the slow decline we've witnessed since a negative divergence printed in late July. Take a look at the current technical picture:
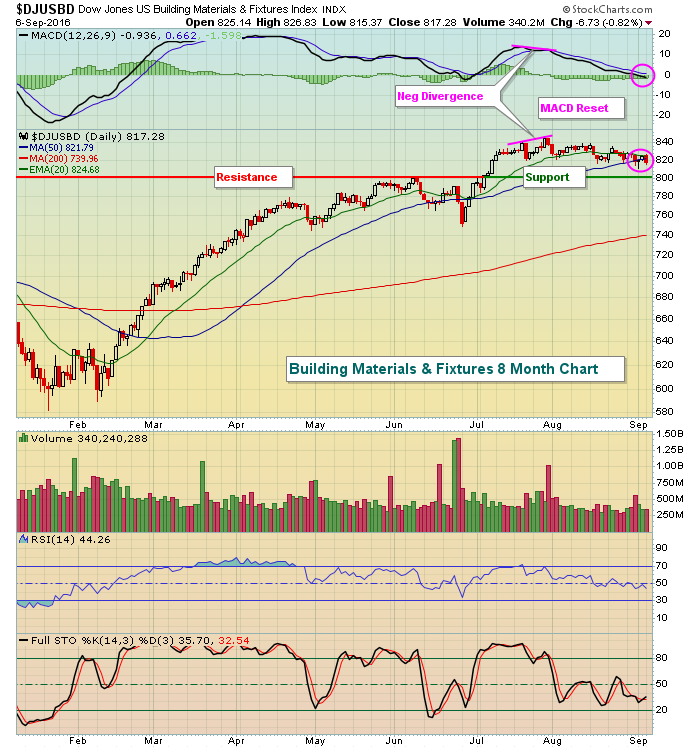 The good news is that the negative divergence is gone. I look for a MACD "reset" after a negative divergence prints, which simply means that the MACD returns to zero. At that point, there is no momentum in the stock as the short-term and long-term moving averages used in the MACD are exactly the same.
The bad news is that the rising 20 week EMA should hold as support since weekly momentum is much stronger. That 20 week EMA, however, currently resides at 798 and if you look at the support/resistance line in the above daily chart, you'll see that support resides at 800.....so don't be surprised by further weakness down to test the 800 area. That would provide a solid level for entry into the group though.
Historical Tendencies
Yesterday I broke down S&P 500 performance between September 1-15 and September 16-30, showing how U.S. equities tend to hold up fairly well during the first half of September while the second half can be a struggle. Below is how the NASDAQ has traded since 1971 during the month of September:
September 1-15: +8.08%
September 16-30: -22.50%
Key Earnings Reports
(actual vs. estimate):
VAL: 1.57 vs 1.44
(reports after close, estimate provided):
HPE: .44
Key Economic Reports
August PMI services index to be released at 9:45am EST: 51.2 (estimate)
Happy trading!
Tom
