Market Recap for Thursday, September 8, 2016
If you haven't noticed, maybe you should. Energy (XLE, +1.87%) is in a bull market, posting 5.17% gains in just the last week! That's not a bad year. It's not like U.S. equities have been soaring either. In fact, over the past week, seven of the nine sectors have produced results between +0.5% and -0.5%. Energy is moving in a flat market. The XLE gain yesterday resulted in another price breakout as you can see below:
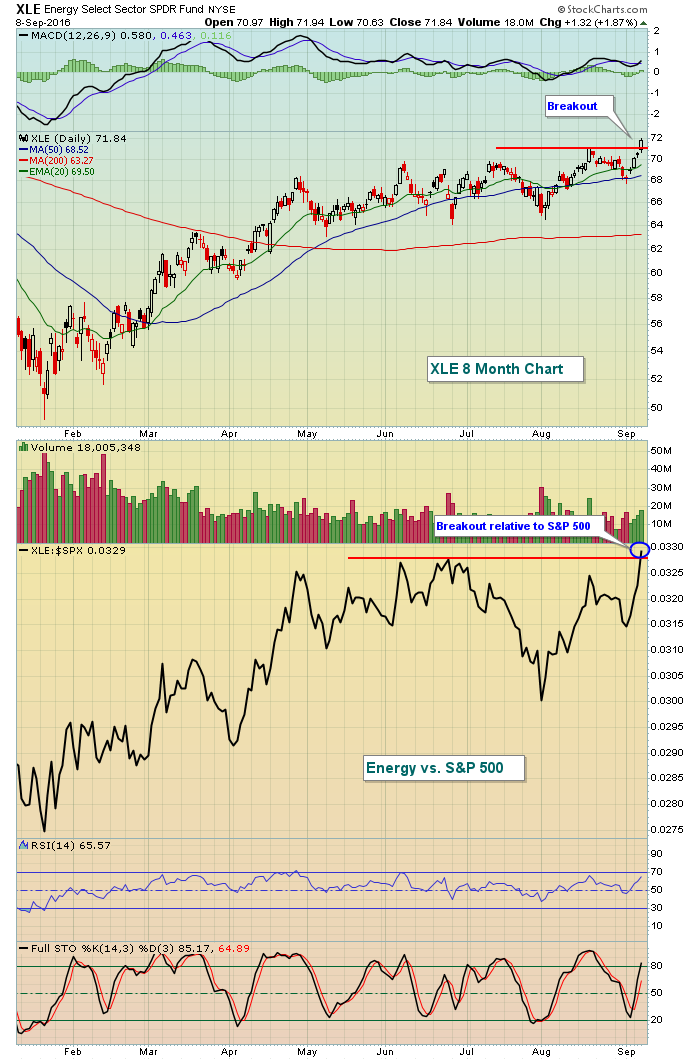 It also broke out on a relative basis vs. the benchmark S&P 500 and I'd expect to see this relative outperformance continue. Crude oil ($WTIC) rose 4.66% on Thursday, providing the tailwinds for the sector. Pipelines ($DJUSPL) have continued their torrid streak with gains now totaling more than 11% over the past five trading sessions. There's a bullish reverse head & shoulders neckline near $51-$52 per barrel that bears watching on crude oil. If that level is cleared, the rise in energy-related shares should continue mostly unabated.
Pre-Market Action
Boston Federal Reserve Bank President Eric Rosengren spoke in Massachusetts this morning and suggested the Fed could fall behind the curve if it fails to raise rates soon. That speech sent traders scurrying out of treasuries with the 10 year treasury yield ($TNX) rising to clear yield resistance near 1.64%. It's also spooked equity traders with Dow Futures down 100 points this morning. It could be a rough start at the opening bell in a few minutes.
Current Outlook
While the action of late has been very frustrating as our major indices mostly consolidate gains from over the summer, let's not forget the "big picture", which is clearly bullish from a price perspective. Here's that big picture look at the S&P 500:
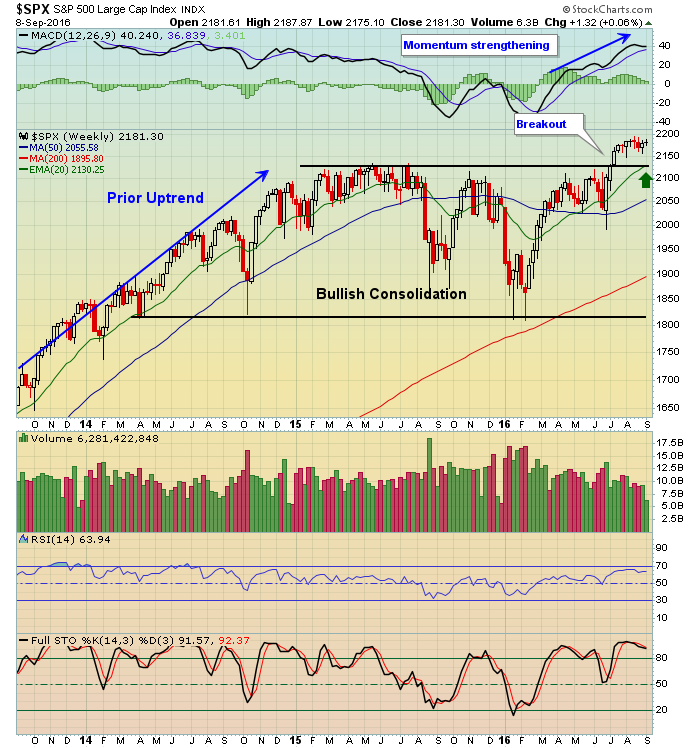 There may be plenty of warning signs out there, but bull markets tend to ignore them. It's very difficult for me to grow overly bearish with the bullish breakout that occurred in July. Do I have my suspicions about the continuing rally? Yes I do and I have for months, but we cannot argue with price action. I would grow more concerned technically if the rising 20 week EMA, currently at 2130, and price support at 2131 are lost on a closing basis and volume accelerates. Until then, I'd use bouts of profit taking as an opportunity to enter technically-sound areas of the market like energy and technology.
Sector/Industry Watch
The utility sector (XLU, +0.34%) is benefiting from a bounce off price support and despite treasury yields rising the past couple sessions. They've been straddling the declining 20 day EMA and with treasury yields rising significantly this morning, a reversal and close beneath that moving average could signal an acceleration of selling. Loss of 48.90 gap support from early June would be particularly damaging technically. Here's the latest chart:
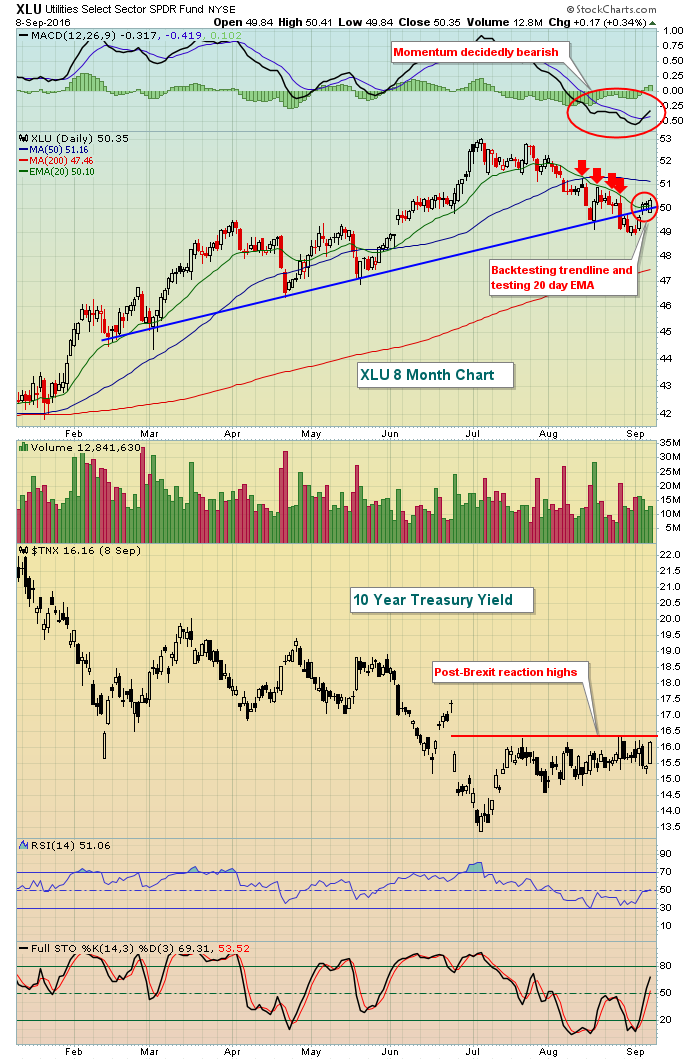 A breakout in the TNX would clearly be a negative for the XLU and this morning's treasury market action is not reflected in the above chart. The TNX is on the rise today after FedSpeak and, at last check, was at 1.65% - pushing above that post-Brexit reaction high highlighted in the chart above. If selling in treasuries continues today (with higher corresponding treasury yields), look for the recent downtrend in the XLU to resume.
Historical Tendencies
September has been an unusual month for small caps (Russell 2000). There's a negative annualized return of -1.77% for the month over the past 28 years, but the $RUT has finished September higher 17 of those years and lower just 11 times. In addition, August, October and July rank as the three worst calendar months for small caps, posting more bearish annualized returns in each of those months.
Key Earnings Reports
(actual vs. estimate):
KR: .47 vs .45
Key Economic Reports
None
Happy trading!
Tom
