Market Recap for Thursday, September 15, 2016
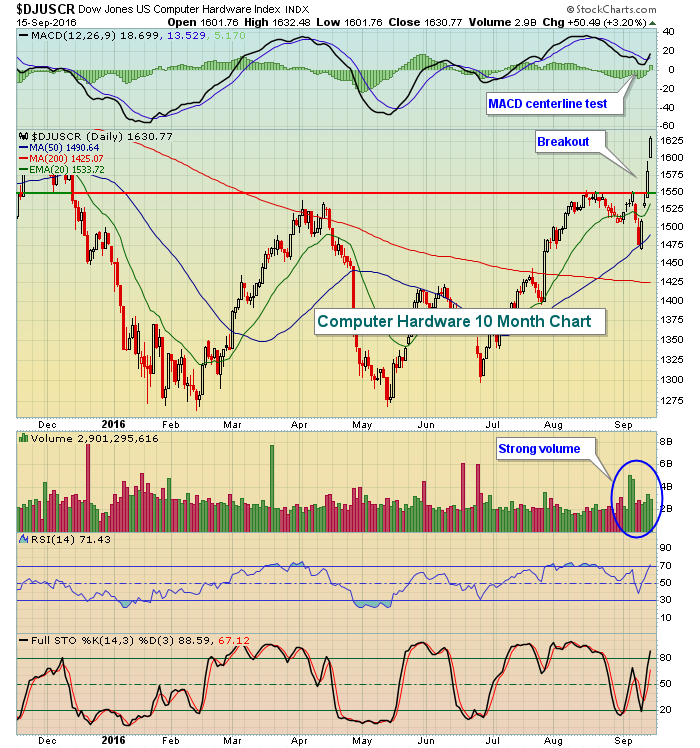
There was plenty of good news to go around on Thursday, which was nice because the bulls have been beaten up a little bit of late. All of our major indices finished with solid gains and all nine sectors advanced. Technology (XLK, +1.64%) was the leading sector once again, led in large part by computer hardware's ($DJUSCR) 3.20% spike. Apple (AAPL) has been very strong over the past four trading sessions, rising from 102.50 to slightly above 115.50 and that's lifted the entire computer hardware group. Check out the chart:
 It wasn't just Apple leading the technology area though. It was a broad-based rally in the entire sector with all but one industry group (internet) moving higher by at least 1%. Consumer electronics ($DJUSCE) actually outperformed computer hardware, rising by 3.36% yesterday. Semiconductors ($DJUSSC) were strong and are featured in the Sector/Industry Watch section below.
Financials (XLF, +0.59%) gained on Thursday, but were the worst performing sector on the session. The good news, however, is that a bullish engulfing candle formed at 50 day SMA support. Take a look:
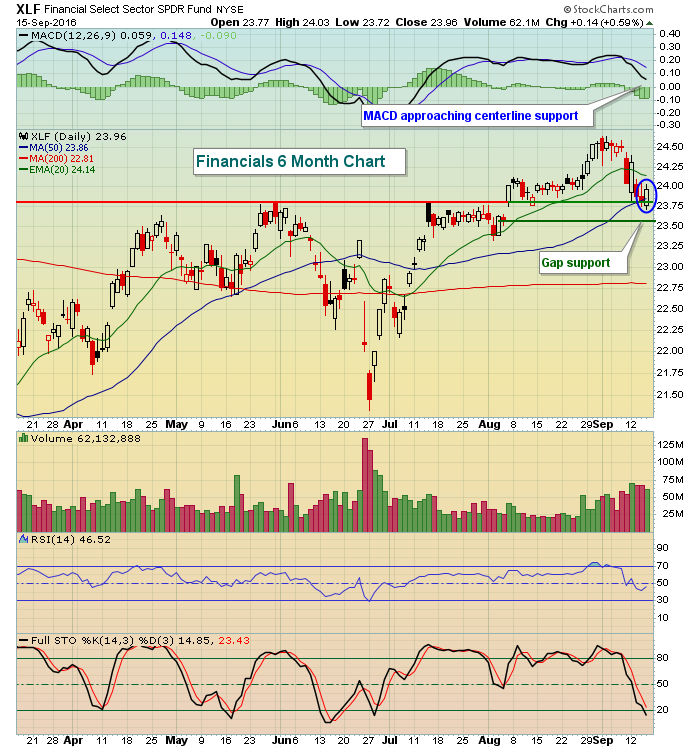 The blue circle highlights that potential reversing (bullish engulfing) candle and the fact that it's occurring at or near key price and gap support provides a bit more confirmation that a reversal will take place. The bigger question is whether it's a short-term reversal or something longer lasting. Watch the gap support level just above 23.50 as failure to hold that level on a closing basis could lead to more short-term selling.
Pre-Market Action
Overnight, Asian markets were mostly higher although China's Shanghai was an exception. European markets this morning, however, are very weak with much of the focus on banks as Deutsche Bank was handed down a large fine and global banks are nervous ahead of the upcoming Fed meeting. Dow Jones futures are down 39 points, although they have recovered from their earlier lows.
Twitter (TWTR) is in the news this morning and up roughly 4% after it live streamed its first NFL game last night.
Current Outlook
Volatility (VIX) has spiked and now our major indices are whipsawing back and forth between short-term price support and a couple levels of key resistance. Apple has certainly helped keep the market afloat, but it's not likely to be able to do so longer-term. Therefore, I'm watching a couple of key levels on the S&P 500 to the upside and downside for further clues on short-term direction. Here's a visual:
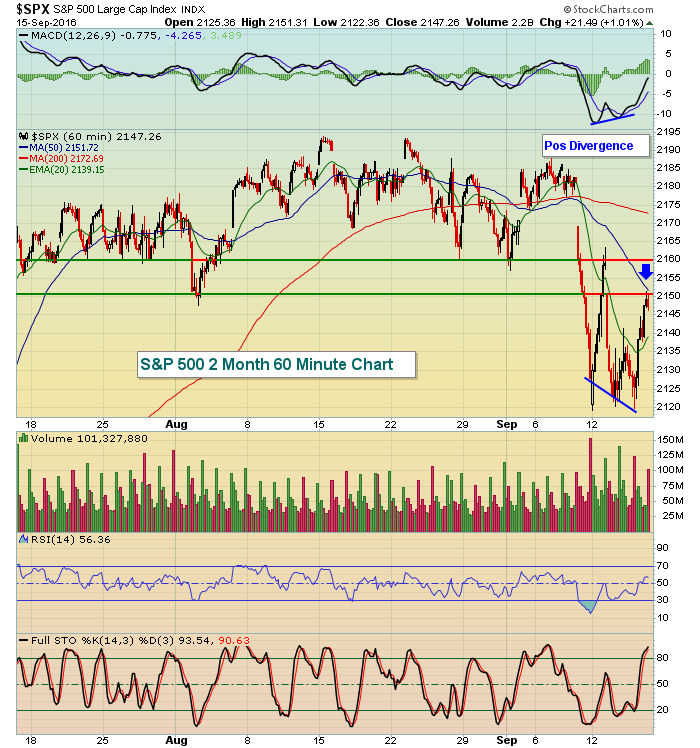 Clearly, the support level are those three trips down to 2120. Failure to hold that support will further encourage those on the short side and I'd expect selling to accelerate. To the upside, 2150-2160 has been the area most difficult for the bulls to negotiate during rallies over the last week. A 60 minute positive divergence emerged and that's allowed price action to move back to the 50 hour SMA, currently at 2151 - between the 2150-2160 price resistance already established. So let's call the current range 2120-2160 for now.
Sector/Industry Watch
The Dow Jones U.S. Semiconductor Index ($DJUSSC) had moved almost nowhere for 6-7 weeks as higher prices in August were haunted by slowing momentum in the form of a negative divergence. After some selling to open up September, the DJUSSC experienced a 50 day SMA test with its MACD moving back close to centerline support for a "reset". Now the DJUSSC is moving up again, check it out:
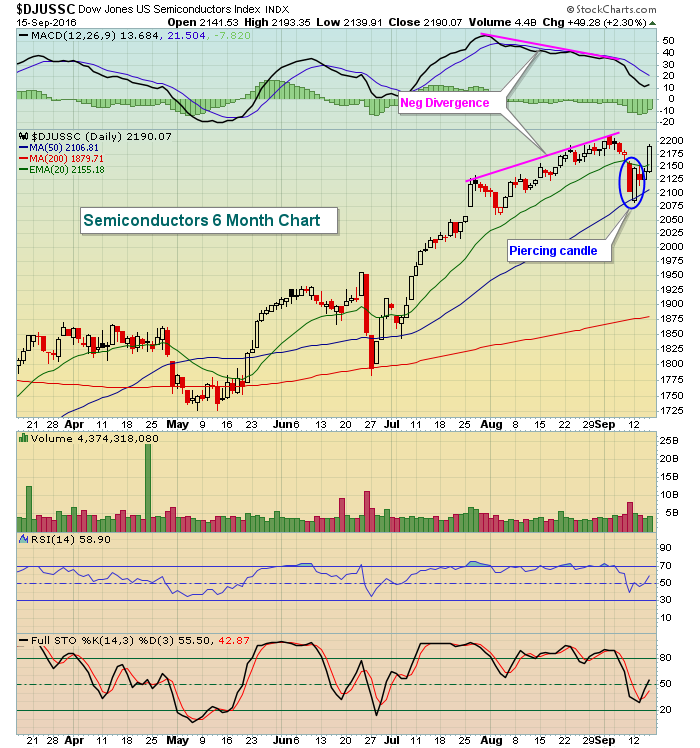 That reversing bullish piercing candle enabled the bulls to regain control of the action and now the DJUSSC has rid itself of momentum issues in my opinion and potentially poised for further gains. But we'll need to see a confirmed high volume breakout first.
Historical Tendencies
It's been well documented here that beginning next week, the market has very bearish tendencies historically through September 27th. Also historically the stock market tends to perform quite well every month from the 28th through the 6th, but October is a strange animal. The end of September through the beginning of October is not nearly as historically bullish as other calendar months. Below are the NASDAQ's annualized returns from the notoriously weak period of September 20th through 27th, followed by September 28th through October 9th:
September 20-27: -27.92%
September 28-October 9: -11.73%
That's nearly three weeks worth of bearish action over the past 45 years of action on the NASDAQ.
Key Earnings Reports
None
Key Economic Reports
August CPI released at 8:30am EST: +0.2% (actual) vs. +0.1% (estimate)
August Core CPI released at 8:30am EST: +0.3% (actual) vs. +0.2% (estimate)
September consumer sentiment to be released at 10:00am EST: 90.8 (estimate)
Happy trading!
Tom
