Special Note
I continue to move into ChartCon 2016 mode, so bear with me as all of us here at StockCharts.com prepare to descend upon California. My travel day is tomorrow so I will not likely post at all. Of course, there's always the possibility of a last minute airport post! :-)
Please check out the ChartCon 2016 information page HERE. The lineup of presentations is designed to provide you with information to improve your investing and/or trading success, depending on your preference. Hope to see you there!
***********************************
The bulls' resilience shone through rather brightly on Monday as market participants ignored two important historical tendencies. First, the 19th day (-34.25% since 1950 on the S&P 500) of the calendar month is THE worst day of the month and second place (9th day, -19.66%) isn't close. While September 19th only performs slightly below average, the 20th begins a string of seven consecutive horrific days in terms of historical S&P 500 performance. Here are the annualized returns for each day of this period:
September 20th (today): -36.99%
September 21st (Wednesday): -56.15%
September 22nd (Thursday): -32.64%
September 23rd (Friday): -35.19%
September 26th (Monday): -51.97%
And while the 24th and 25th fall on a weekend this year, their annualized returns of -29.89% and -41.09%, respectively, are atrocious as well. Simply put, the bulls have their historical hands full this week.
But......the S&P 500 is clinging to short-term price support while remaining in an overall bullish price pattern longer-term, as shown below:
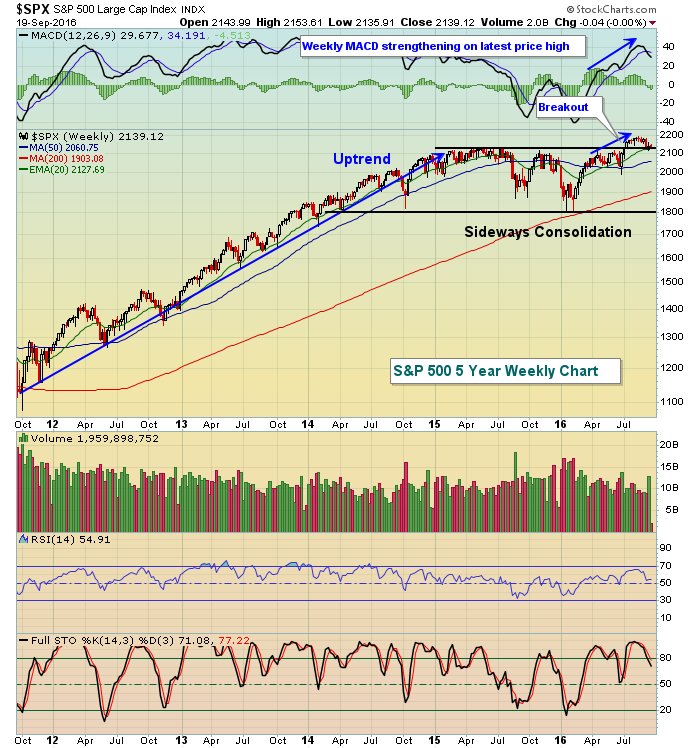 When I look at this chart alone, it's very difficult for me to be anything other than bullish. There's a huge advance followed by a bullish two year consolidation. Finally, we get the breakout to an all-time high with the weekly MACD surging to new highs as well. What's not to like? Well, for me it's not about the surface breakout to all-time highs. It's easy to love that. Instead, it's about what has been leading this breakout.
My favorite relative ratio to truly gauge the strength of a rally or acceleration of a decline is the XLY:XLP, which simply watches how consumer discretionary stocks perform relative to consumer staples stocks. If the economy is truly expected to strengthen and market participants believe it, discretionary stocks should outperform. It's as simple as that. Before we take a look at how this ratio currently stacks up, take a look at how the S&P 500 and XLY:XLP correlate over the years:
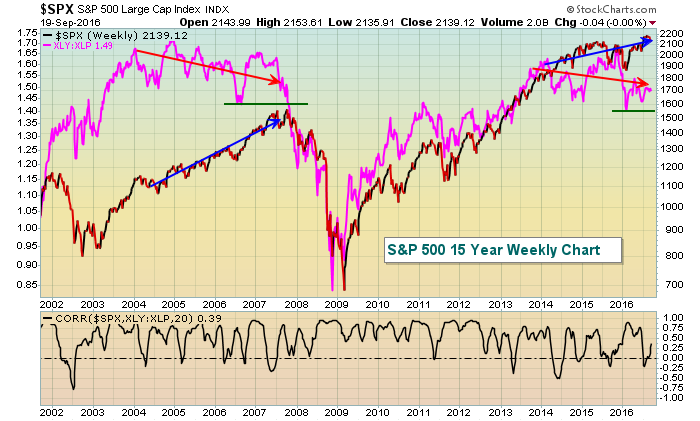 At the bottom of the chart above, you can see that the correlation between the S&P 500 and the XLY:XLP is almost always positive and many times between .75 and 1.00. That's pretty solid evidence that the benchmark S&P 500 benefits from strength in the relative performance of discretionary stocks. The problem currently is that the XLY:XLP ratio has been in decline over the past couple years while the S&P 500 pushes to fresh highs. Look at the action in these two just prior to the October 2007 top - it was nearly identical. It's very difficult to pinpoint an exact top in the S&P 500, but it's equally important to recognize that there are potential "beneath the surface" issues that could create accelerated selling in the weeks and months ahead. Watch the relative support line (green line) on the XLY:XLP. If that relative support is lost, my guess would be that a bear market has begun. Until then, I remain cautiously bullish.
Happy trading!
Tom
