Special Note
My blog articles will be brief the next two days as I prepare for ChartCon 2016. I will be traveling on Wednesday so there will be no article that day. While in California, my blog schedule will not be set so I'll simply post when I have time and am able. ChartCon 2016 begins this Friday (!!!) and you still have time to register for this awesome event. CLICK HERE for more information!
Stock prices fell on Friday, but there was were no price support violations despite the weakness. The S&P 500 has been trading in a 2120-2160 range and the selling on Friday didn't change that. Here's a reprint of the S&P 500 chart I presented on Friday:
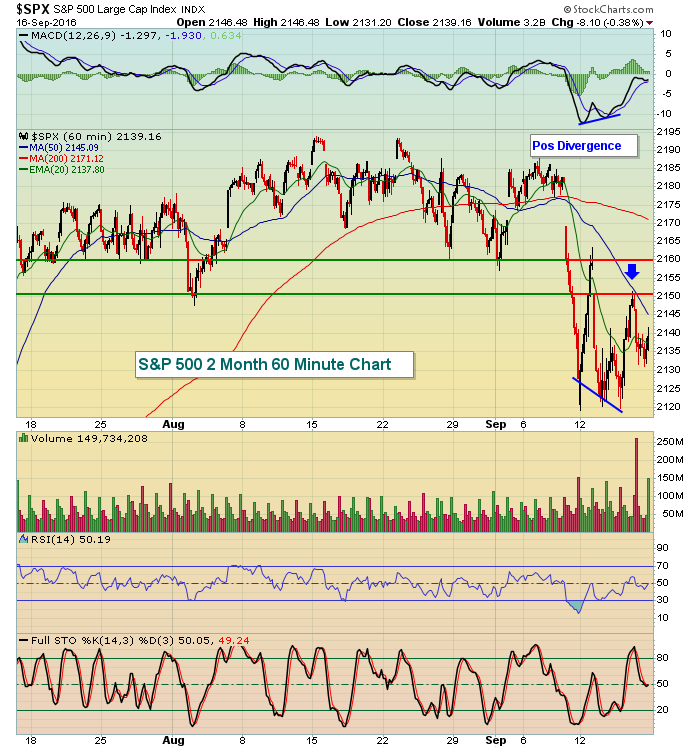 The last two rally attempts stalled at 2160, then 2150 and that makes perfect technical sense as you can see lows in August were at those same two levels. Broken support becomes resistance, that's TA 101. This morning, futures are strong to open the week and could catapult the S&P 500 back to that initial resistance level near 2150. We'll see if the bulls have the strength to navigate that 2150-2160 resistance range.
From a daily chart and more intermediate-term perspective, you can see the S&P 500 declining beneath both of its key moving averages - 20 day and 50 day - to hit price support at 2120. The now-declining 20 day EMA is at 2160 to add more technical drama at that level. The weekly chart (not shown here) features strong momentum and a rising 20 week EMA that's currently at 2125 (near that 2120 price support). So the battle lines have been drawn and we'll now see whether the bulls or bears grab control of the market based upon which way it breaks.
Banks ($DJUSBK) have struggled of late, despite the fact that the 10 year treasury yield ($TNX) has been on the rise. First, take a long-term weekly view of banks:
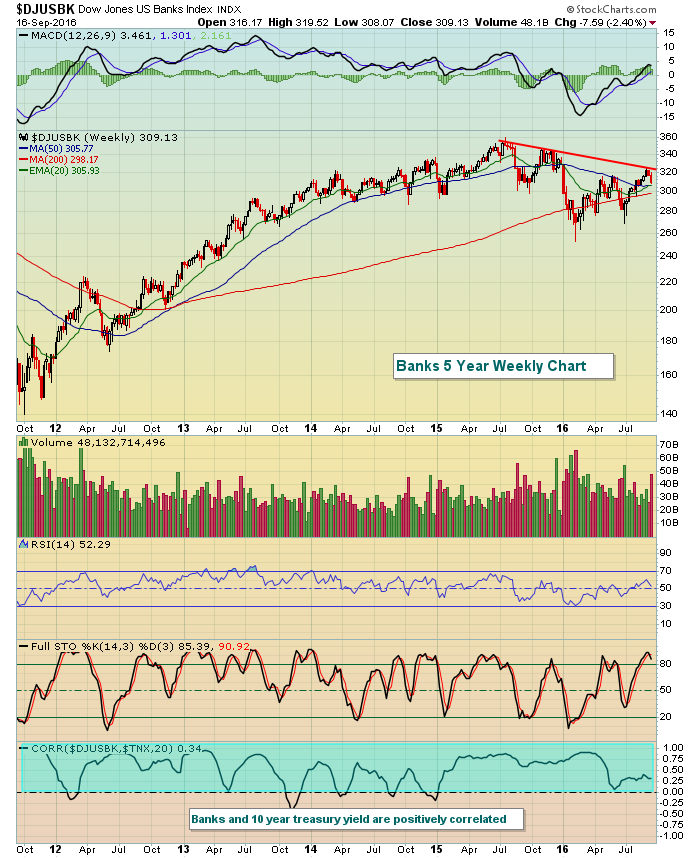 The bulls failed at trendline resistance last week, making the 325 level very significant technically on future rally attempts. To the downside, banks currently reside at their 50 day SMA (daily chart not shown). At the bottom of the above weekly chart, you can see that banks and the TNX are very positively correlated, meaning that they tend to move in the same direction in the short-term (20 periods is the default), although there are dips occasionally into negative territory. But for the most part they move in the same direction. So let's look at the latest development with banks and the TNX on the following 60 minute chart:
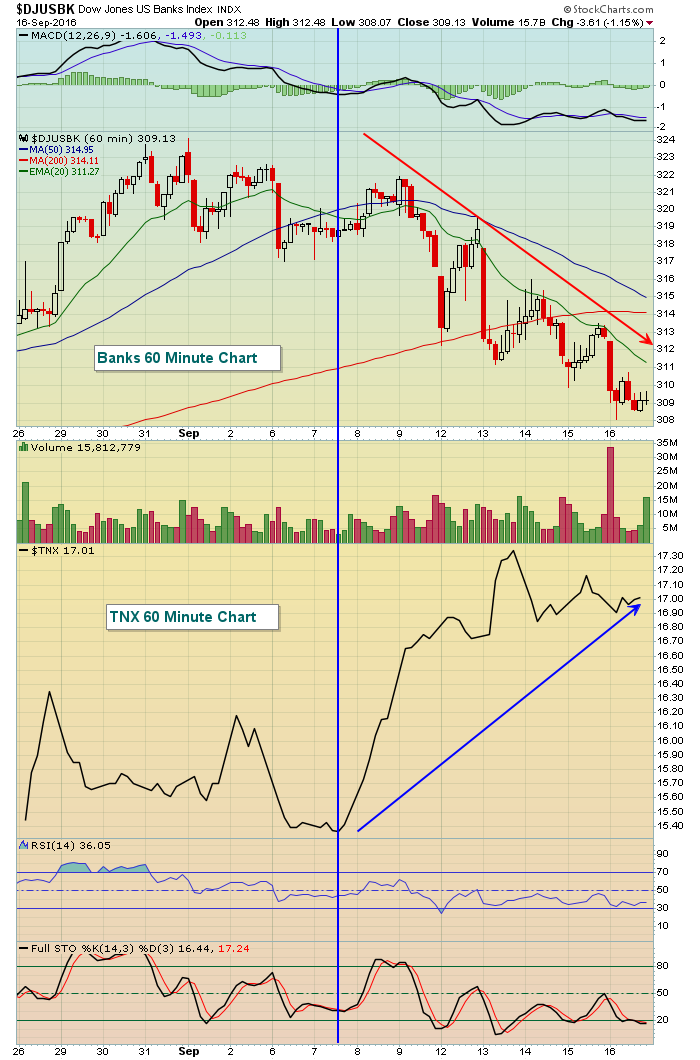 A little more than a week ago, this relationship changed. The TNX has exploded higher, from 1.54% to 1.73% at its peak - all while banks have tumbled. What happened to the positive correlation? I'm not sure, but I'd guess that the longer-term positive correlation will resume meaning that one of these is likely to reverse big time over the next couple weeks.
Happy trading!
Tom
