Market Recap for Friday, October 14, 2016
The U.S. stock market ended last week in bifurcated fashion with the NASDAQ and S&P 500 barely finishing in positive territory, while the Russell 2000 lost 0.27%. The Dow Jones was the most bullish index, gaining 0.22% to close out the week. The bulls were relieved to end Friday above key price support tested earlier in the week. While this kick save was clearly a bullish short-term technical signal, the underlying strength last week came from utilities and consumer staples, the only two sectors to finish the week in positive territory. Also, if you break down financials, it's rather obvious that defense was leading as REITs were the top four industry groups last week in that sector.
The Dow Jones REIT index did bounce nicely for the week, but it was held back at its declining 20 day EMA after holding onto intermediate-term price support. Check out the chart:
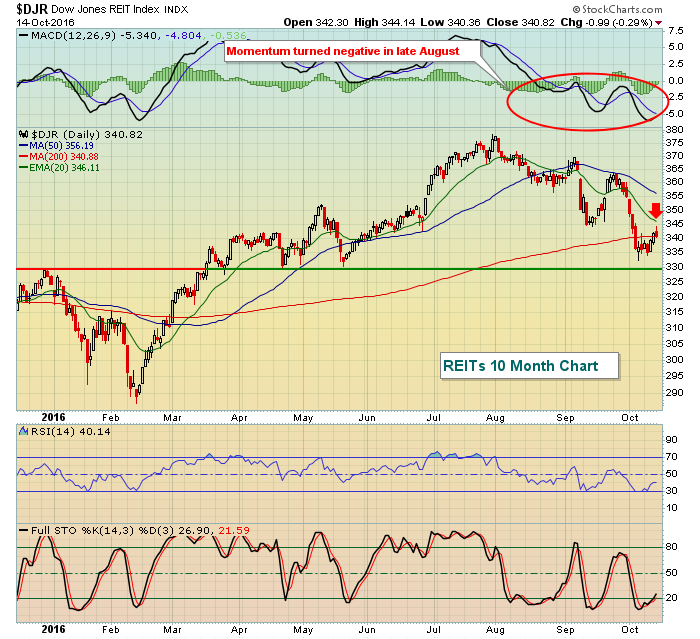 The 20 day EMA is the moving average to watch here. If REITs turn back down with other defensive sectors, then the bulls' hopes will be pinned to aggressive areas of the market - the way it should be. If areas like consumer discretionary and technology don't pick up the slack, then it's inevitable that the S&P 500 breaks 2120 price support. At that point, we'll have a completely different technical environment for equities and subsequent action will have to be evaluated to determine if bear market behavior has begun.
Healthcare stocks (XLV) were very weak last week and the culprit was biotechnology ($DJUSBT). That industry is featured below in the Sector/Industry Watch section.
Pre-Market Action
U.S. futures are flat with Dow Jones futures down a mere 11 points and the S&P 500 futures down 1 point. Asia was mostly lower overnight and that weakness is carrying over into Europe. Crude oil ($WTIC) is down fractionally and the dollar has gained ground. That's bad news for gold and we've seen recent breakdowns in that commodity. Further strength in the dollar will only add to weakness there.
Bank earnings continue to pour in ahead of expectations with Bank of America (BAC) the latest to produce strong quarterly results (.41 vs .34). I'd expect to see the banks provide a lift for the Dow Jones at the open, but we'll soon find out.
Current Outlook
The 10 year treasury yield ($TNX) has been on the rise of late, breaking above multi-month yield resistance of 1.74%. Those higher yields typically produce higher profits for groups like life insurance ($DJUSIL) and banks ($DJUSBK). So it should be no surprise that these two groups have been performing very well relative to the S&P 500. In order for this strength to continue, we'll likely need to see the TNX hold 1.74% yield resistance and/or its rising 20 day EMA, currently at 1.70%. Technically, here's how the DJUSIL looks at the moment:
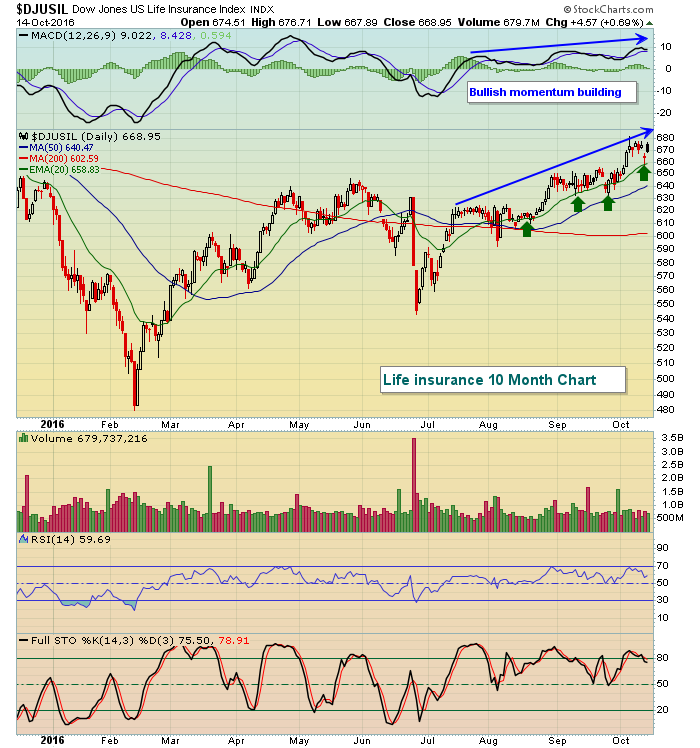 As prices rise, we want to see the MACD moving to new highs with intermittent tests of the rising 20 day EMA. That's what we've seen out of life insurance for the past 2-3 months. Until it changes, I'd expect to see this pattern continue, aiding the bull market in the process.
Sector/Industry Watch
Biotechnology stocks ($DJUSBT) had a very rough week last week, dropping 5.75%. That weakness saw prices fall beneath recent price support near 1690. The long-term picture for the DJUSBT is suspect at best, so the short-term price breakdown should not be ignored. If you're considering this group for long-entry, I'd only consider the best of the best, which in my opinion would include Amgen (AMGN). Here's a chart of both:
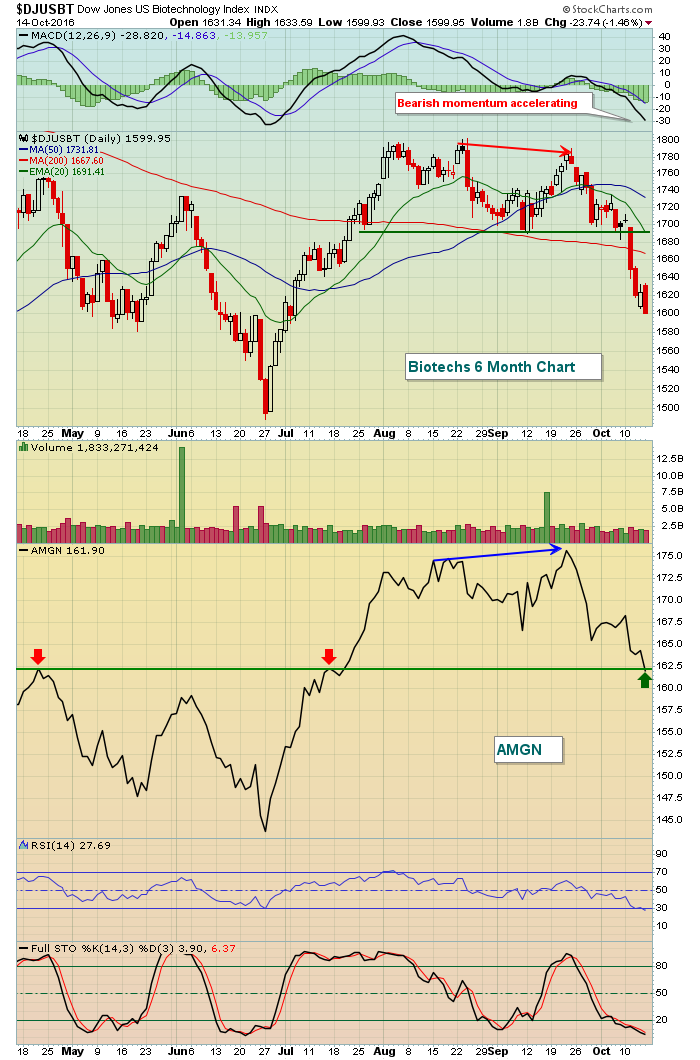 AMGN recently posted strong quarterly earnings and was outperforming its peers, as evidenced by the fresh late September high while the DJUSBT was floundering beneath earlier price resistance. AMGN is now at price support at 162, so the reward to risk at this point is solid.
Historical Tendencies
Mondays have produced the worst results of any calendar day of the week. On the S&P 500 since 1950, Mondays have produced annualized losses in excess of -15%. Mondays that fall during the 19th to 25th period and 7th to 10th period tend to produce the worst results.
Key Earnings Reports
(actual vs. estimate):
BAC: .41 vs .34
HAS: 2.03 vs 1.74
JBHT: .97 vs 1.02
(reports after close, estimate provided):
CE: 1.61
IBM: 3.21
NFLX: .06
UAL: 3.05
Key Economic Reports
October empire state manufacturing survey released at 8:30am EST: -6.8 (actual) vs. +1.00 (estimate)
September industrial production released at 9:15am EST: +0.1% (actual) vs. +0.2% (estimate)
September capacity utilization released at 9:15am EST: +75.4% (actual) vs. +75.6% (estimate)
Happy trading!
Tom
