Market Recap for October 18, 2016
Healthcare (XLV, +1.20%) performed extremely well on Tuesday, despite being the worst performing sector over the past month. There may have been some bottom fishing in the group as United Health (UNH) surged nearly 7% to lead the health providers group ($DJUSHP) to relative outperformance. Here's a chart of the rebound in the DJUSHP:
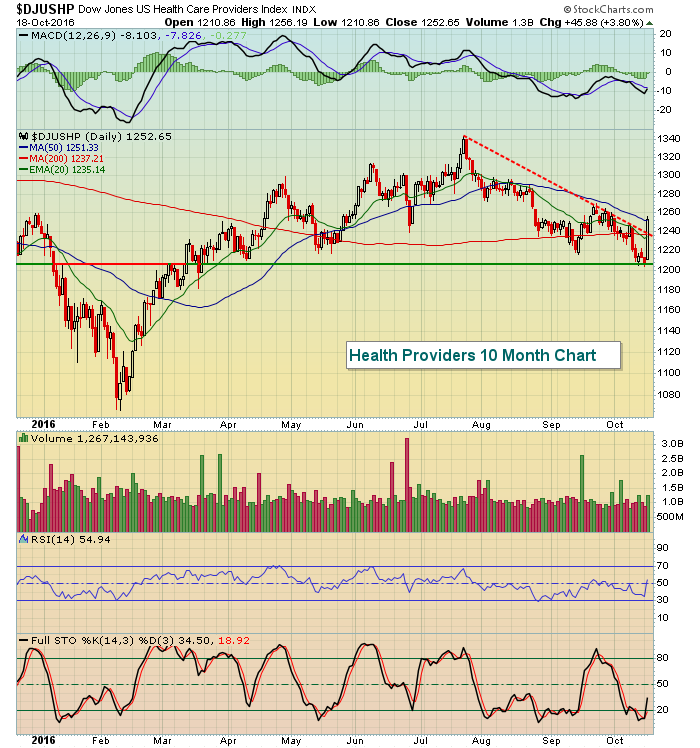 Performance in the DJUSHP yesterday was its best daily performance of 2016 and now establishes major price support just above 1200. Loss of that level would re-establish the prior downtrend. I believe this recovery marks a bottom so long as the S&P 500 remains in a bullish price pattern (ie, above 2120).
All nine sectors finished higher on Tuesday in a widely participated advance, a bullish development. Crude oil ($WTIC) prices were higher by more than 1% and continues to hover near a major breakout level in the $51-$52 per barrel range. A breakout there would be extremely bullish for the energy sector (XLE, +0.40%) as this group looks to continue its market leadership.
Pre-Market Action
Quarterly earnings continue to be quite strong in financials, especially in the banking, investment services and life insurance areas. Goldman Sachs (GS) reported very strong earnings earlier this week and today it's Morgan Stanley (MS). Banks have a long winning streak of solid EPS results this earnings season and helps to explain their relative strength heading into earnings season. The next relative breakout on banks ($DJUSBK) vs. the S&P 500 would be a very significant one. Check this out:
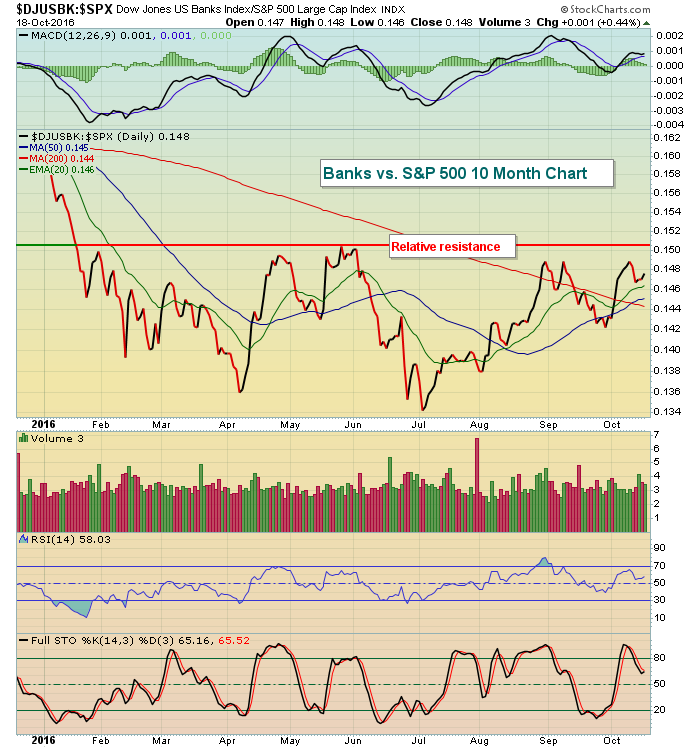 Higher treasury yields benefit banks and obviously better-than-expected earnings can't hurt. So banks have been performing exceptionally well vs. the benchmark S&P 500 since the post-Brexit lows. But there's more work to be done to truly expect more relative strength ahead. The group needs to clear its relative resistance level at .151. That would mark its highest relative level since January, clearing an area that's been problematic for the last nine months.
U.S. futures are up slightly, looking to build upon positive momentum from the recent and successful price support test. Global markets were mostly flat overnight and this morning so we'll look to the U.S. market today for short-term directional clues.
Current Outlook
This is a bullish week historically for U.S. equities, but next week is historically the worst for the benchmark S&P 500. The long-term outlook is quite cautious in my view, although price action remains bullish. Therefore, I'd mostly ignore the bearish "under the surface" signals of the market until price support is lost. The first closing price support violation on the S&P 500 would be 2120. Here's an hourly chart over the past five months that highlights the current trading range:
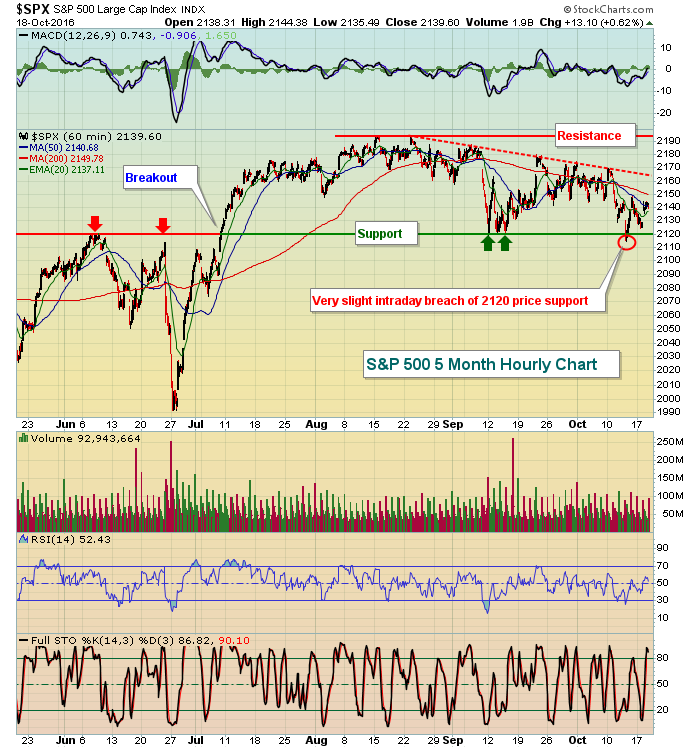 Because it's an hourly chart, it's difficult to see individual candlesticks, but that's really not important here. Instead, focus on the key levels of price support (2120) and price resistance (2190). I want to see which level breaks first as that will give us the best directional signal on the S&P 500. In addition to price resistance, a key trendline resistance near 2165 will come into play as well. The more times prices test a trendline, the more important the trendline. In the case of this hourly S&P 500 chart, you can see at least five separate tests of trendline resistance that currently intersects near the 2165 level. Clearly, a break above trendline resistance, followed by a break of price resistance, would be bullish.
Sector/Industry Watch
Copper ($COPPER) has been downtrending for a long, long time and is currently in a continuation pattern to the downside as it's been squeezing in a bearish symmetrical triangle throughout most of 2016. First, check out the pattern on copper on its long-term chart:
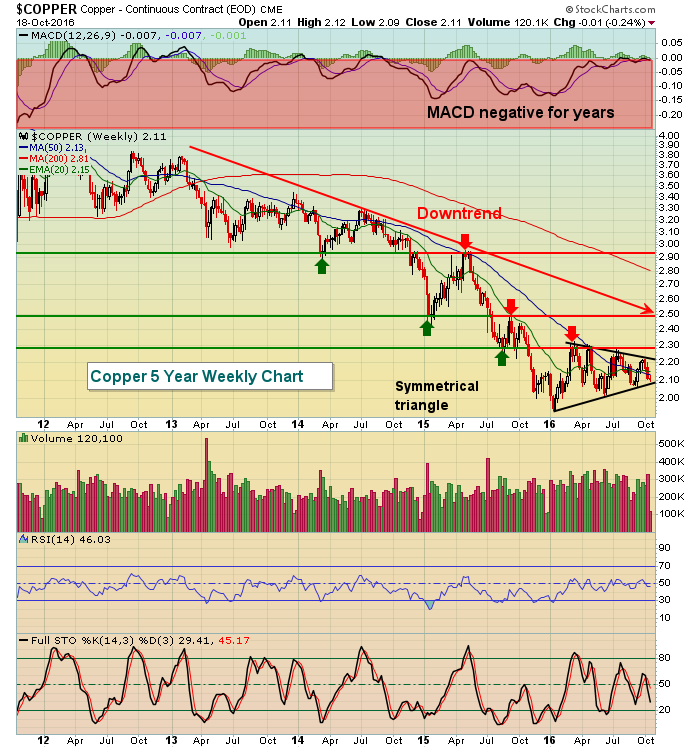 While the pattern is bearish and most likely outcome is a breakdown, I'd change my tune to a much more bullish stance if copper breaks the triangle to the upside and can clear price resistance at 2.30. Check out those horizontal lines. Each time price support (green arrows) has been broken the past few years, prices rebound only to price resistance (red arrows) before turning lower once again. So if copper could break the triangle to the upside and 2.30 is cleared, it would likely lead to much higher copper prices.
One stock that is in a bottoming formation and would benefit by a breakout in copper prices is Freeport-McMoran (FCX). Check this out:
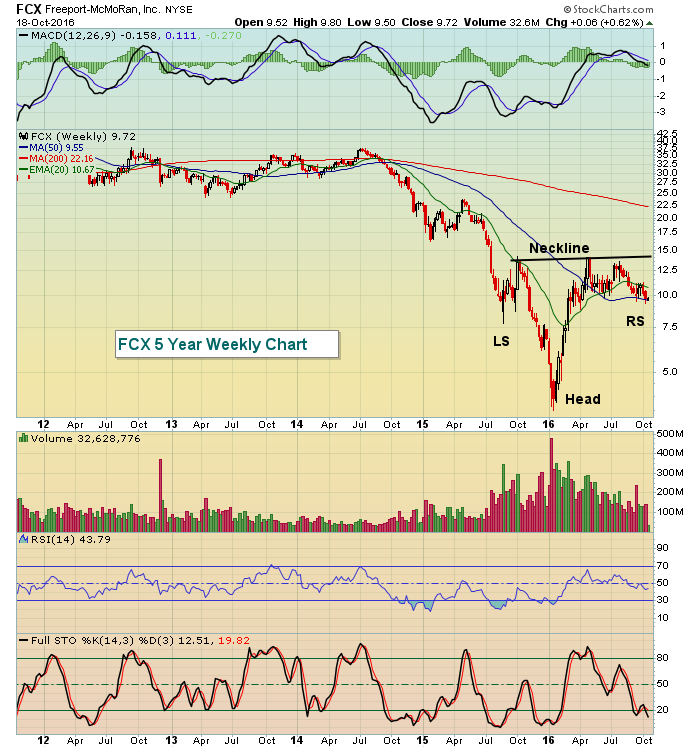 Just keep in mind if copper prices break to the upside, we could confirm a very bullish reverse head & shoulders pattern on FCX by clearing neckline resistance in the 14.00-14.50 range. A very aggressive entry would be now while FCX is in its reverse right shoulder. The problem is that copper's most likely direction from here is down due to its continuation pattern. A better reward to risk trade would exist on a breakout on FCX.
Historical Tendencies
The 19th day of the calendar month is the worst calendar day of the month on the S&P 500 since 1950. It has an annualized return of -34.25%. October 19th is the worst performing 19th among the twelve calendar months. Of course, October 19th was BLACK MONDAY in 1987 during that year's crash. The only calendar months to produce gains (and they are very slight) on the 19th are July, September and December.
Today is October 19th.
Key Earnings Reports
(actual vs. estimate):
ABT: .59 vs .58
APH: .68 vs
ASML: 1.04 vs 1.07
BBT: .76 vs .70
CP: 2.12 vs
GPC: 1.29 vs
HAL: .01 vs. (.07)
MS: .80 vs .64
MTB: 2.13 vs 2.04
NTRS: 1.08 vs 1.08
RAI: .61 vs .64
STJ: .99 vs 1.01
STX: .89 vs
USB: .84 vs .84
(reports after close, estimate provided):
AXP: .96
CTXS: .97
EBAY: .36
KMI: .15
LRCX: 1.77
LVS: .59
MAT: .70
SLG: 1.52
TSCO: .66
URI: 2.45
XLNX: .54
Key Economic Reports
September housing starts released at 8:30am EST: 1,047,000 (actual) vs. 1,180,000 (estimate)
September building permits released at 8:30am EST: 1,225,000 (actual) vs. 1,165,000 (estimate)
Beige book to be released at 2pm EST
Happy trading!
Tom
