Market Recap for Thursday, October 13, 2016
It got a little scary during Thursday's morning session as key support was lost on an intraday basis. Fortunately for the bulls, it wasn't lost for very long as U.S. equities rallied and printed hammers across the board. A hammer is a reversing candlestick that reflects renewed buying pressure after a downtrend and earlier selling pressure. The S&P 500 opened Thursday to the downside but above 2120 closing price support. 30 minutes into the session, the S&P 500 dipped to 2115 and traders were getting very nervous. But then this happened:
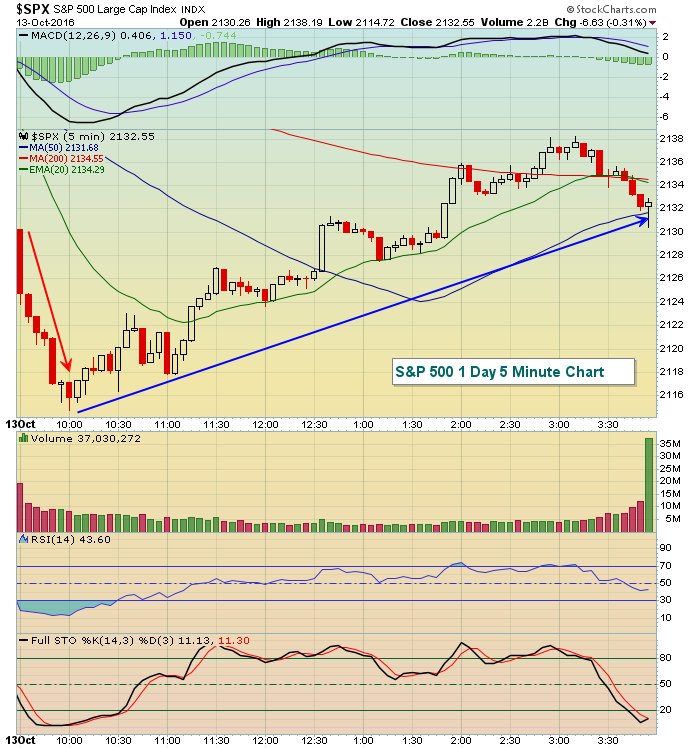 There was intense selling during the first 30 minutes of action and price support at 2120 was temporarily broken. However, that selling came to a rather abrupt end and buyers emerged for most of the session. The significance of this "kick save" can more easily be seen on the S&P 500's daily chart. Take a look:
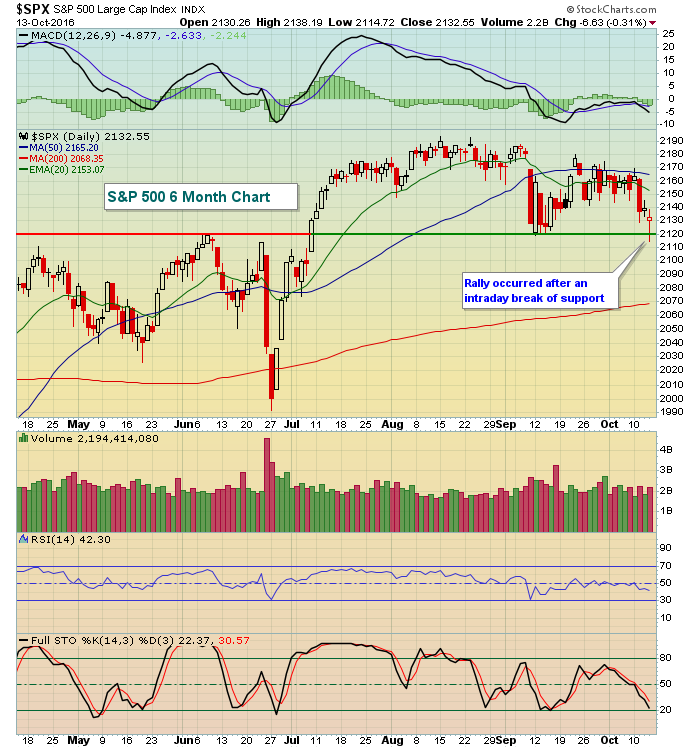 The S&P 500 was in trouble at 10am EST on Thursday, only to see a very nice recovery unfold. This weakness coincided with a Volatility Index ($VIX) to nearly 18 before settling down with "only" a 4.9% spike. The VIX finished at 16.69, its highest close in a month. The bulls will be looking for a steep decline in the VIX today to lower traders' fear levels.
Utilities (XLU, +1.24%) was the only sector to end the day with meaningful gains. Financials (XLF, -0.97%) were easily the weakest sector as banks saw a ton of profit taking after their recent winning streak and as treasury yields fell on Thursday. Banks ($DJUSBK) are featured in the Sector/Industry Watch section below.
Pre-Market Action
Besides strong U.S. futures, the most notable thing in pre-market this morning is that four banks reported quarterly results and all four topped Wall Street consensus EPS estimates. Also, the 10 year treasury yield ($TNX), after testing its breakout at 1.74% on Thursday, is moving higher once again today - up to 1.77% at last check. Rising treasury yields generally help bank's bottom lines. So the one-two punch of consistently better-than-expected results this morning and an improving environment for future earnings have produced four big banks trading higher in pre-market action.
Dow Jones futures are up nearly 100 points and crude oil has jumped 1% as the U.S. moves higher in tandem with Asian and European markets, most of which are solidly higher over the past 24 hours.
Current Outlook
Thursday's action reinforces the notion that significant price support exists at 2120 on the benchmark S&P 500. Previously, closing price resistance was established at 2190. Therefore, the key short-term range hasn't changed. It remains 2120-2190. If we make another push higher toward 2190, I'll be watching to see the rotation among sectors to determine if money rotates toward more aggressive sectors like technology, financials, consumer discretionary and industrials. If those sectors, relative to the benchmark S&P 500, are moving higher, the likelihood of a sustainable bull market rally increases. Should defensive groups lead, however, then expect the rally attempt to fail with another test of 2120 price support much more likely.
Sector/Industry Watch
The Dow Jones U.S. Banks Index ($DJUSBK) completed the right side of its cup earlier this week and the selling the past few days has finished off the handle. Now with several banks reporting better-than-expected quarterly results, this group will be looking for the breakout to potentially send banks much higher. Check it out:
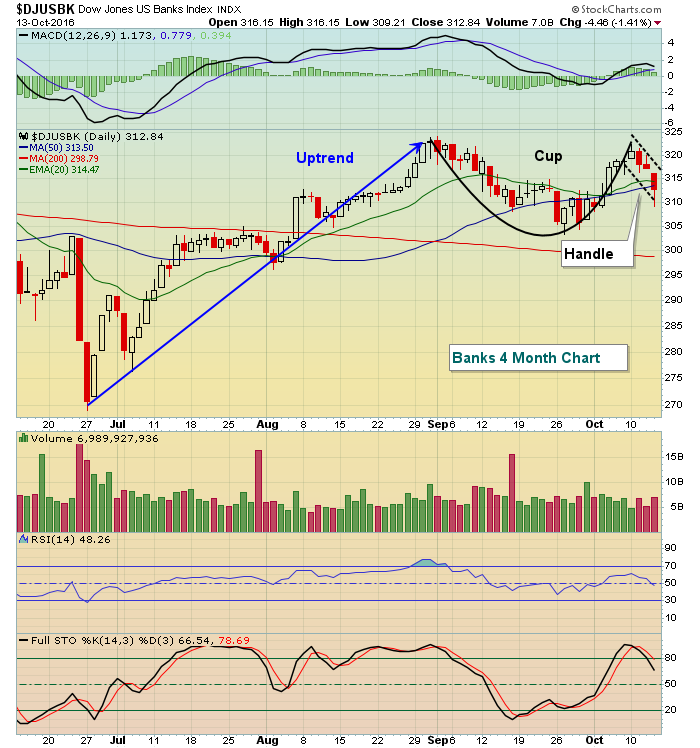 A cup with handle pattern is a bullish continuation pattern. This means that you need to have a prior uptrend in play, which we clearly do. A short-term top must form and, after a temporary pullback, another advance follows to print a second top very close to the first. Then a final pullback occurs to set the handle. In my opinion, that occurred yesterday. A breakout would measure to roughly 345. The measurement is determined by the distance between the top and bottom of the cup, or approximately 21 points. This is added to the breakout level of 324 to arrive at the 345 measurement.
Historical Tendencies
Over the past 20 years, October has ranked as the best calendar month in terms of S&P 500 performance. October has also been bullish for small cap stocks (Russell 2000), but it hasn't been as solid as a month for the RUT as it has for the SPX. Here are the numbers over the past 20 years for the RUT:
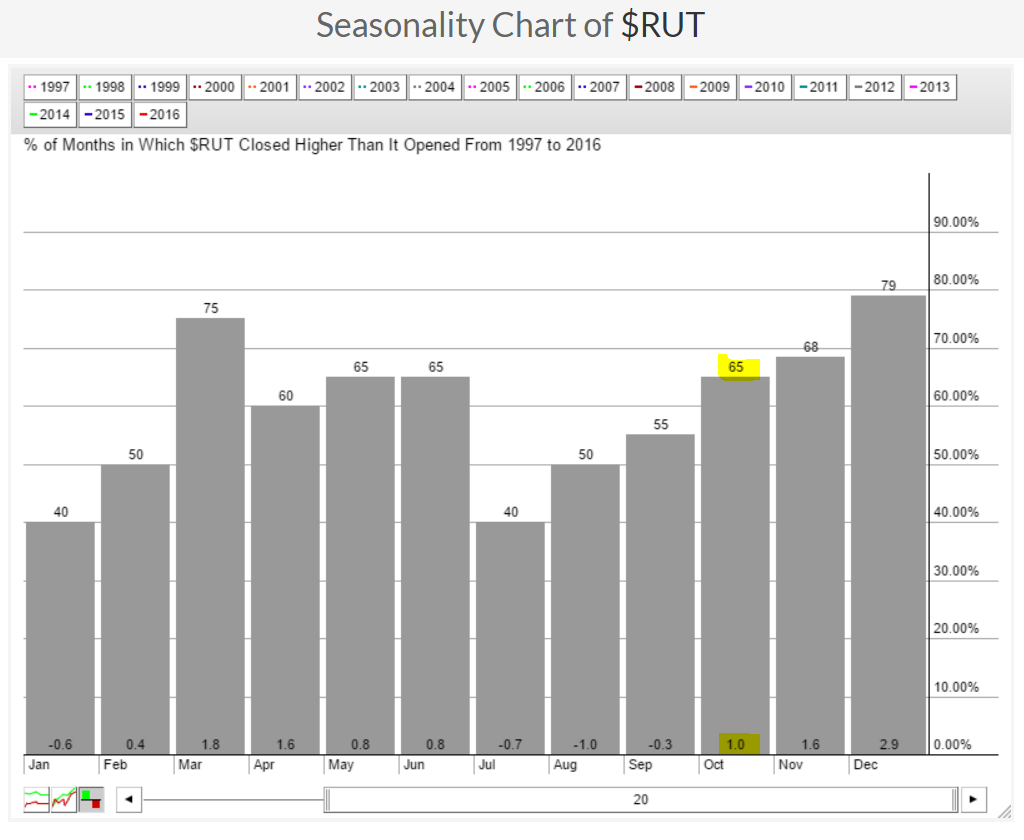 The good news is the summer has ended. While you may enjoy the beach during the summer months, the stock market heads for the hills. The three worst consecutive months for Russell 2000 performance is rather obvious: July, August and September. October, however, begins a very bullish nine month period for small caps from October through June, with January being the only exception.
Key Earnings Reports
(actual vs. estimate):
C: 1.25 vs 1.16
JPM: 1.58 vs 1.40
PNC: 1.84 vs 1.78
WFC: 1.03 vs 1.02
Key Economic Reports
September PPI released at 8:30am EST: +0.3% (actual) vs. +0.2% (estimate)
September Core PPI released at 8:30am EST: +0.2% (actual) vs. +0.1% (estimate)
September retail sales released at 8:30am EST: +0.6% (actual) vs. +0.6% (estimate)
September retail sales ex-auto released at 8:30am EST: +0.5% (actual) vs. +0.5% (estimate)
August business inventories to be released at 10:00am EST: +0.1% (estimate)
October consumer sentiment to be released at 10:00am EST: 92.0 (estimate)
Happy trading!
Tom
