Market Recap for Tuesday, December 27, 2016
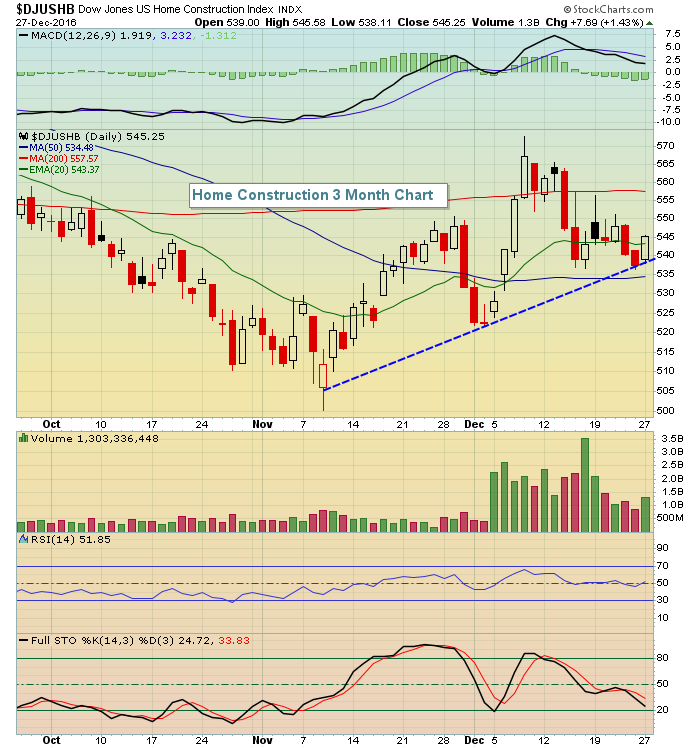
Eight of the nine sectors rose on Tuesday with only consumer staples (XLP, -0.02%) losing ground. The NASDAQ and Russell 2000 once again were the leading indices, powered by home construction ($DJUSHB) and renewable energy ($DWCREE). Home construction looks very interesting on both its daily and weekly charts as trendline support continues to hold on both. Here's the visual on both:
DJUSHB - daily:
 DJUSHB - weekly:
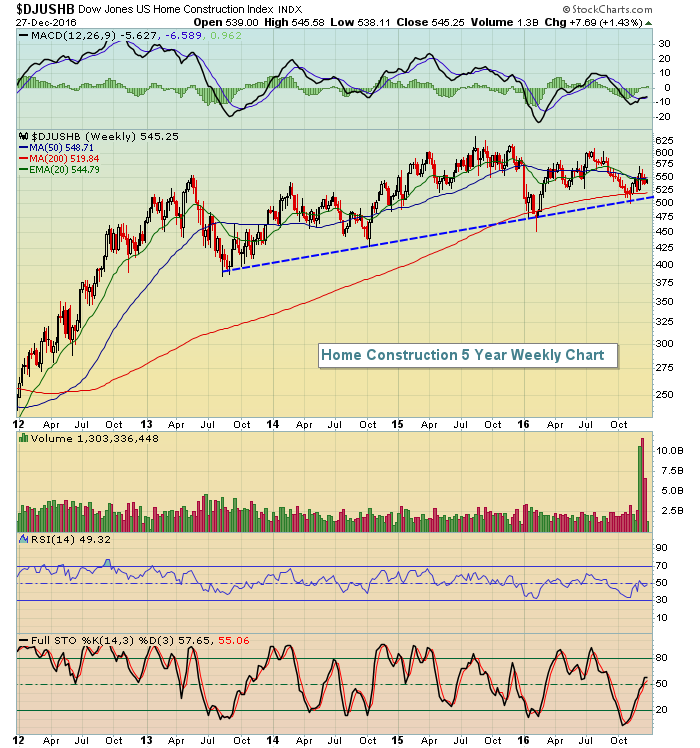 So long as these trendlines hold, it's difficult to be bearish the group, despite the rising interest rate environment.
Pre-Market Action
Crude oil ($WTIC) is down fractionally this morning after closing near $54 on Tuesday, its highest close since early July 2015. Energy stocks (XLE) have performed extremely well during this advance and I see both crude and the XLE continuing its rise in 2017.
The Hang Seng Index ($HSI) bounced nicely overnight after touching key support. I wouldn't be surprised if the bottom is in based on this chart:
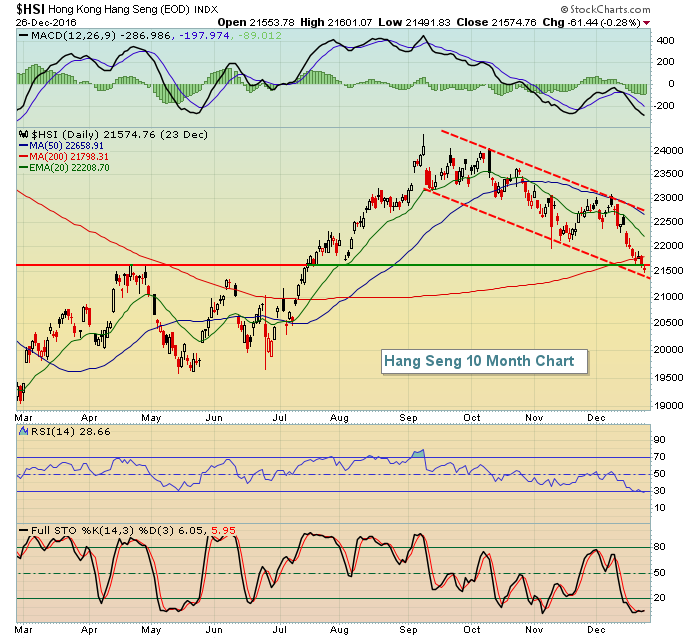 The recent down channel has just tested price support close to 21500 and the overnight advance of 180 points now establishes the prior day's low as a key support. Keep in mind this down channel follows a very bullish 20% three month advance. A break above the upper downtrend line would confirm the next leg higher in my view. Aggressive traders could use the support test as an early entry with a tight stop beneath.
European stocks are mixed this morning with mostly flat action. The Dow Jones futures are up 36 points with an hour to go before today's open.
Both the earnings and economic calendars are light today with only pending home sales, due out at 10:00am, a key report for traders to watch.
Current Outlook
Momentum is strengthening on NASDAQ stocks as they've made fresh new all-time highs. That bodes well for this rally continuing into 2017. In addition to the technical breakout, January is the best calendar month for NASDAQ stocks since 1971. The NASDAQ has produced average annualized returns of 28.21% over the past 45 years, although that seasonal strength was much stronger in the 1970s through 1990s than it has been since 2000. Still, January remains a solid month for equities.
The outperformance of the NASDAQ vs. the S&P 500 is strongest during the month of January as the following seasonality chart shows:
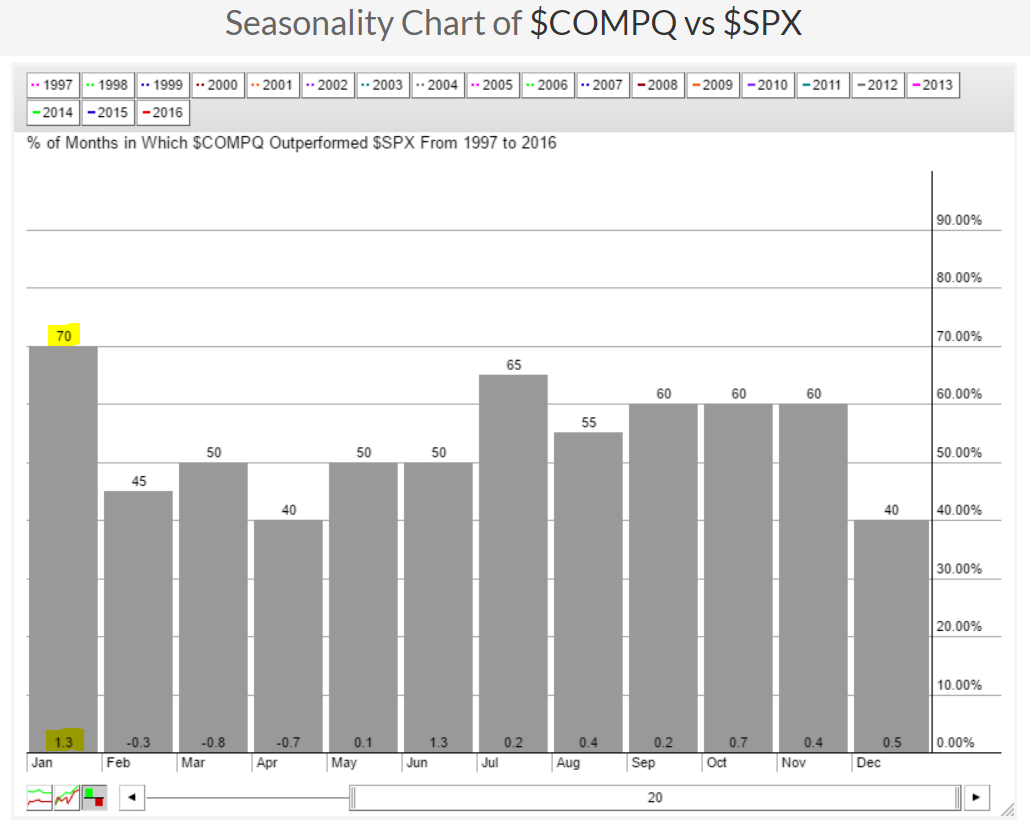 The NASDAQ averages beating the S&P 500 by 1.3% over the past 20 years. Clearly, you want to skew your portfolio more towards the riskier NASDAQ in January.
Sector/Industry Watch
Materials (XLB) have been rising throughout this bull market and a question came up recently that asked how can the XLB continue rising with many of the basic materials like gold and silver performing so poorly? Well first, check out this chart:
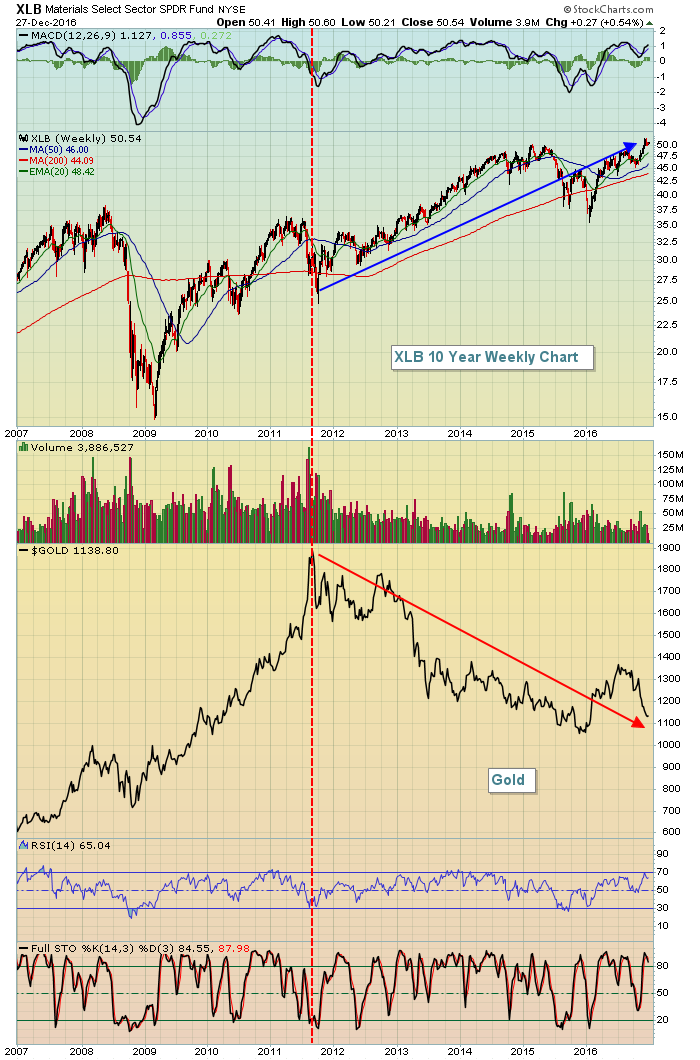 There's no doubt that gold topped 5 years ago and the XLB continued to march higher. The reason is that the XLB is an ETF that moves based on its underlying basket of stocks. If you look at the holdings in the XLB, you'll quickly realize that its top 10 holdings represent 65% of the ETF and none of these stocks are related to gold. In fact, just 3 stocks - DuPont (DD), Dow Chemical (DOW) and Monsanto (MON) - represent nearly one third of the XLB performance.
Historical Tendencies
The Russell 2000 has produced annualized returns of 56.98% during the period December 26 through December 31 over the past 29 years. The RUT led the action yesterday, along with the NASDAQ. This is not at all unusual based on history and we should probably expect that to continue the balance of the week.
Key Earnings Reports
None
Key Economic Reports
November pending home sales to be released at 10:00am EST: +0.5% (estimate)
Happy trading!
Tom
