Market Recap for Friday, December 2, 2016
Friday saw continuing bifurcation, but with this time the NASDAQ and Russell 2000 leading while the Dow Jones and S&P 500 lagged. Rotation wasn't all positive, however, as utilities (XLU, +0.91%) and consumer staples (XLP, +0.64%) led the rally. Financials (XLF, -1.09%), on the other hand, finally saw some relief from very overbought conditions as key interest rate sensitive industry groups suffered as 10 year treasury yields ($TNX) may have topped near-term. The TNX weekly chart shows that yield resistance was near 2.50% and that's exactly where the yield went on Thursday. That likely prompted treasury buyers, resulting in a declining TNX and profit taking in recent winners in the financial arena. But the relative leadership in financials - in the bigger picture - remains strong. Take a look:
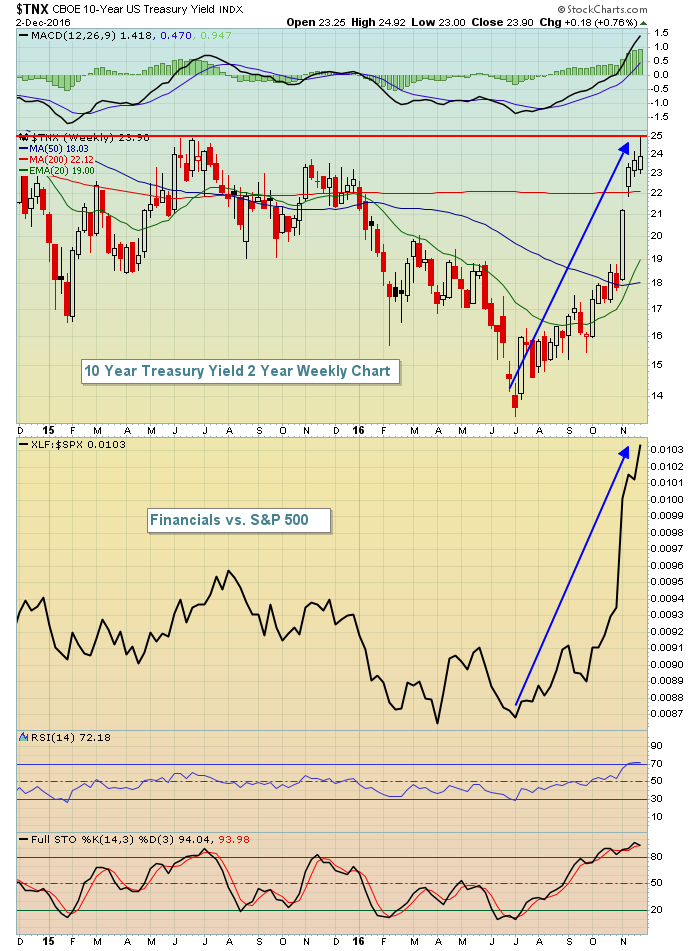 So yes, financials took a needed breather on Friday, but I'd be careful drawing longer-term conclusions. Financials remain a must-own area of the market, but the timing for entry will be important because the sector is very overbought.
Consumer discretionary (XLY, -0.55%) was also weak on Friday with automobiles ($DJUSAU) a big reason. We saw a nice breakout on Thursday within this space so the lack of follow up is a bit disappointing. The shorter-term chart remains technically bullish as the following shows:
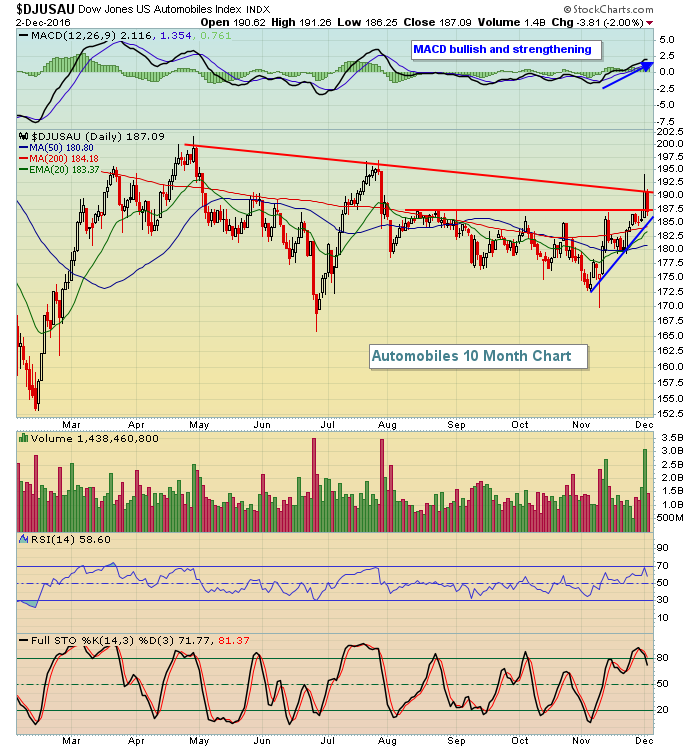 There's a seven month downtrend line that needs to be cleared, but the last month shows a solid uptrend line which did manage to clear four month resistance at 187.50. The selling was harsh on Friday and rising 20 day EMA support now is in focus and needs to hold.
Pre-Market Action
Asian markets were weak overnight, but European indices are up nicely with the German DAX higher by 1.26% this morning on the heels of a key referendum in Italy where it's expected that Prime Minister Matteo Renzi will resign.
Crude oil ($WTIC) is higher and battling MAJOR overhead resistance near $52 per barrel. A close above would trigger a significant reverse head & shoulders breakout that measures to $75-$80 per barrel. That would likely ignite an already strong energy sector.
Dow Jones futures are up 85 points as the NASDAQ, in particular, tries to rally off its big selling late last week.
Current Outlook
I like the action that's taken place over the past month and am bullish. There's no denying, though, that the short-term strength has led to overbought conditions recently in many areas of the market. It's not unusual to see temporary relief in the form of profit taking when our major indices become overbought. The same happens when we see short-term oversold conditions as well. Such conditions arise when the RSI hits 30 and stochastic drops below 20. Many times that combination will mark at least a near-term bottom. Check out the S&P 500's current hourly chart:
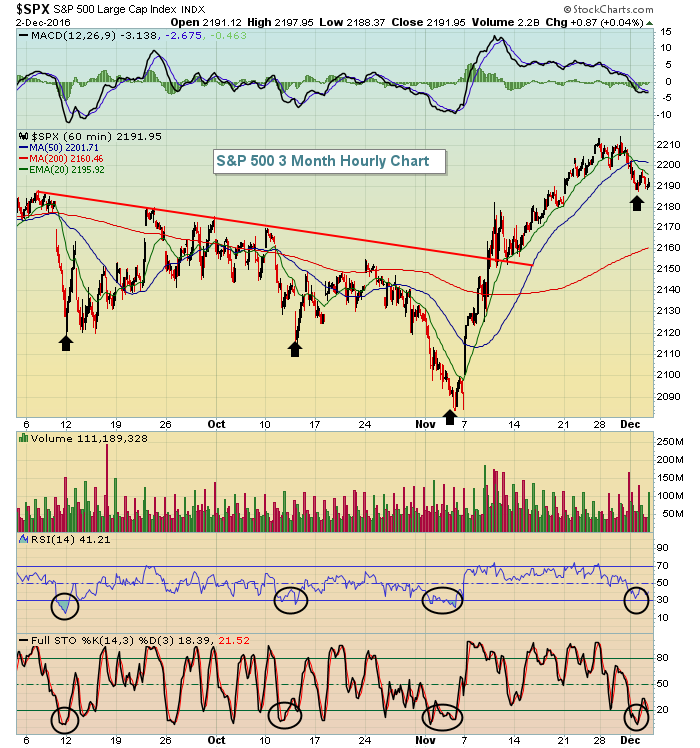 Over the past three months, we've seen the combination of RSI and stochastic drop to or below key thresholds and each time we've be at or very close to a short-term bottom. This provides hope that we'll see renewed strength in the near-term.
Sector/Industry Watch
The Dow Jones U.S. Heavy Construction Index ($DJUSHV) became one of the strongest industry groups in November as the DJUSHV managed to clear significant overhead price resistance just shy of 420. That followed a lengthy consolidation period, making the setup a very solid one. Testing the breakout would be a bullish entry point and is something to watch for in December, especially if we see more profit taking on our major indices. Here's the current view on the DJUSHV:
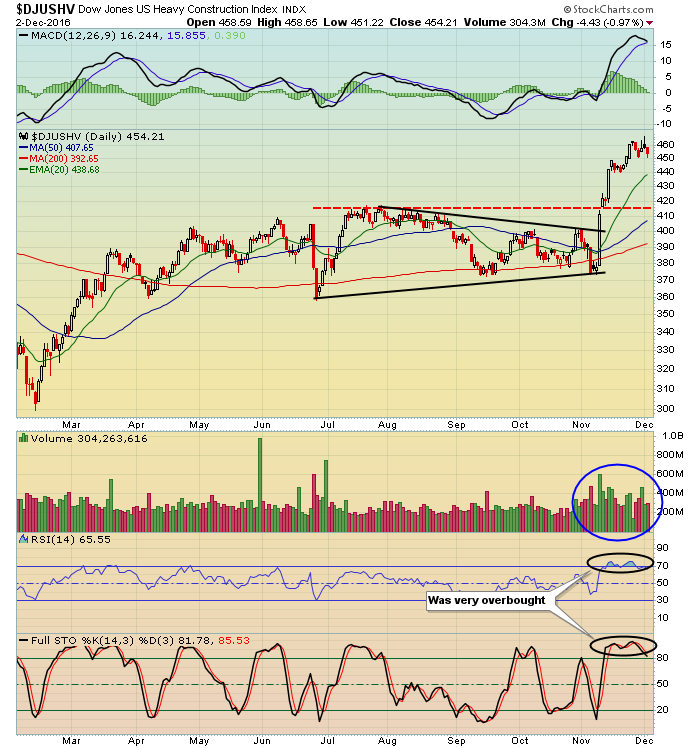 Prior to the latest breakout, the DJUSHV was set up quite bullishly as a symmetrical triangle had formed following a prior uptrend. We typically see these continuation patterns break in the direction of the prior trend, which we did. However, check out the overbought conditions recently with the RSI and stochastic near 80 and 100, respectively. The group deserved a rest and we saw that on Friday. It changes nothing here technically - in fact, we should expect further short-term profit taking down to at least the rising 20 day EMA. If that doesn't hold, then there's key price support down just beneath 420.
Monday Setups
The following is an interesting chart where I'd expect to see a price bounce soon:
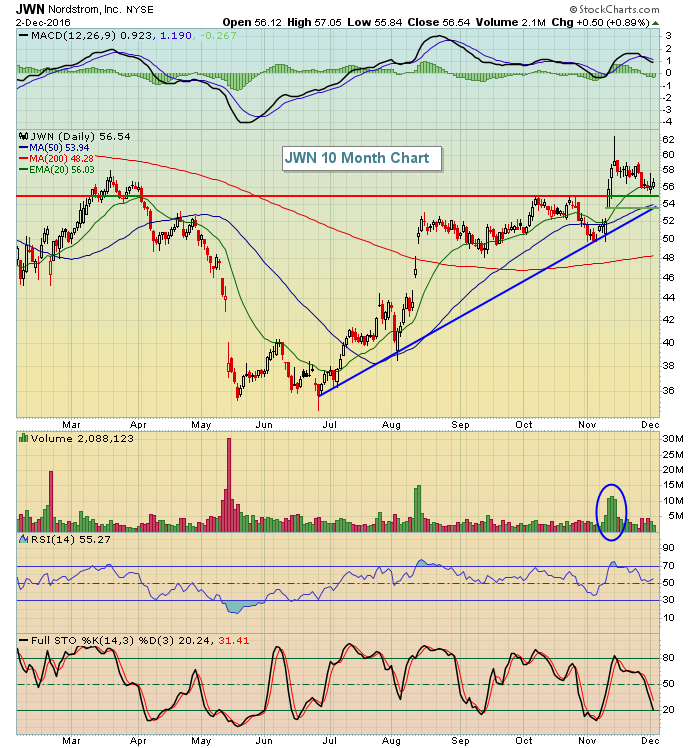 JWN recently reported better than expected revenues and EPS when it released its latest quarterly earnings. The stock jumped on very heavy volume and has since pulled back with its RSI falling from 75 to near 50. In my view, it represents a much better reward to risk trade now. I'll discuss this setup and a few more during my Trading Places LIVE webinar today that begins at 1pm EST. Please join me if you can.
Historical Tendencies
The S&P 500 tends to perform very well in early December, but that historical strength starts to slow this week and eventually turns bearish as we head into the middle of December. Because of the holidays and slower volumes later in the month, some monthly norms get turned upside down during this calendar month. For instance, the 11th to the 18th is a very bullish period historically for nearly every calendar month.....except December. The 11th to 15th is particularly weak in December as you can see from the annualized returns by day. Check this out:
December 11th: -50.10%
December 12th: -14.82%
December 13th: -9.90%
December 14th: -47.29%
December 15th: -29.25%
This doesn't guarantee us lower prices during this period. Instead, we should just be aware of the tendency for the S&P 500 to pause. The good news? The second half of December is extremely bullish. I'll provide more details of this seasonal strength later this week or next week.
Key Earnings Reports
None
Key Economic Reports
November non-ISM manufacturing index to be released at 10:00am EST: 55.5 (estimate)
Happy trading!
Tom
