Market Recap for Friday, January 6, 2017
Let's party like it's 1999.....9. Do you think that big round numbers don't matter on Wall Street? If so, you might want to think again. Since December 13th, the Dow Jones ($INDU) has traded above 19950 on nine separate occasions without once clearing 20000, not even on an intraday basis. Friday's high of 19999.63 stopped just 0.37 points shy of that magical number. Is it really that meaningful though? Not really, but it gives CNBC some material to talk about ad nauseam.
So let's discuss what really matters technically and on Friday it was the technology sector (XLK, +0.73%), which broke out to another fresh new high. The exciting part is that the internet space ($DJUSNS) led the charge with a key technical breakout of its own. Have a look:
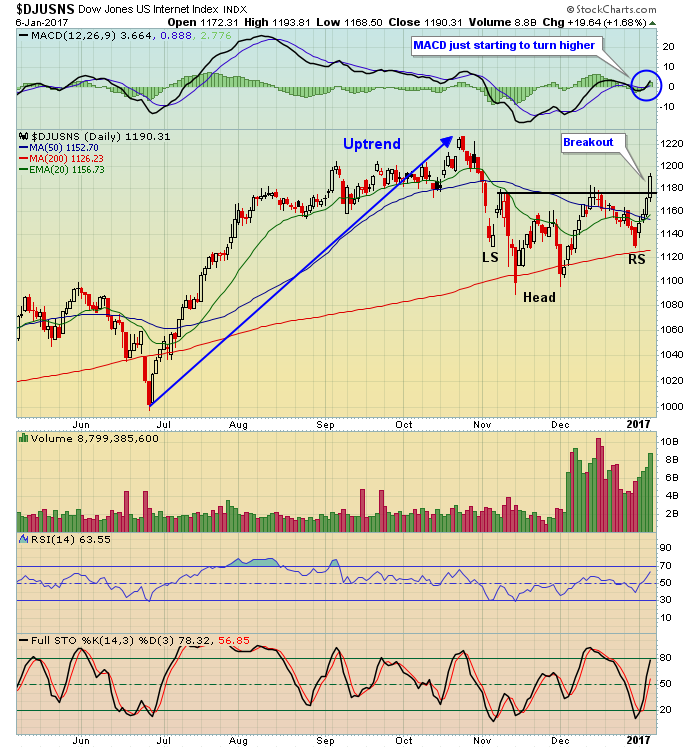 This is a classic inverse head & shoulders continuation pattern. The idea is that it "continues" its prior trend, which I've shown was a clear uptrend (blue directional line). The inverse head & shoulders pattern develops during a period of consolidation. And on Friday, that pattern broke to the upside, which is expected given the prior uptrend in place. The best news is that there's a measurement on this pattern to the 1270 area. The measurement is calculated by subtracting the inverse head (approximately 1090) from the neckline (roughly 1180), which is 90 points. Add that to the breakout level of 1180 and you get 1270. Now the bad news. Seasonally, technology really struggles during the calendar year until we hit September. Over the past 20 years, the DJUSNS from the January to August period averages gaining 3.8%. From September through December, the average gain over the same 20 years is 17.0%. These are average absolute gains, not annualized. Still, technical indications rule over seasonal patterns so I'd look for the 1270 measurement to eventually be realized, probably this month or next.
Pre-Market Action
It's a quiet morning in terms of earnings and economic news, but it's really just the calm before the storm. Alcoa (AA) is set to report its earnings later today and we'll begin to see some big banks reporting later in the week with JP Morgan Chase (JPM), Bank of America (BAC) Wells Fargo (WFC) and PNC Financial (PNC) all reporting on Friday morning before the opening bell. I point these four out because the banks have enjoyed a huge advance since early November and market participants are expecting very solid earnings growth. We'll get their latest results in just four days and the market reaction will dictate whether the short-term run in banks is over for awhile. From a seasonal perspective, January and February are the worst two consecutive calendar months for bank performance in absolute terms and also relative to the benchmark S&P 500.
The Dow Jones does not appear ready to clear its psychological 20000 barrier today - at least not at the open with Dow futures down 42 points with 30 minutes left until the opening bell.
Current Outlook
Since breaking out above 1347 in early December, the Russell 2000 has been stuck in a fairly narrow trading range between 1355 and 1388. Therefore, the two short-term price support levels are at 1355, then that 1347 breakout level. But with a negative divergence currently in play, I would not rule out a trip to the 50 day SMA, currently at 1311. Check out the chart:
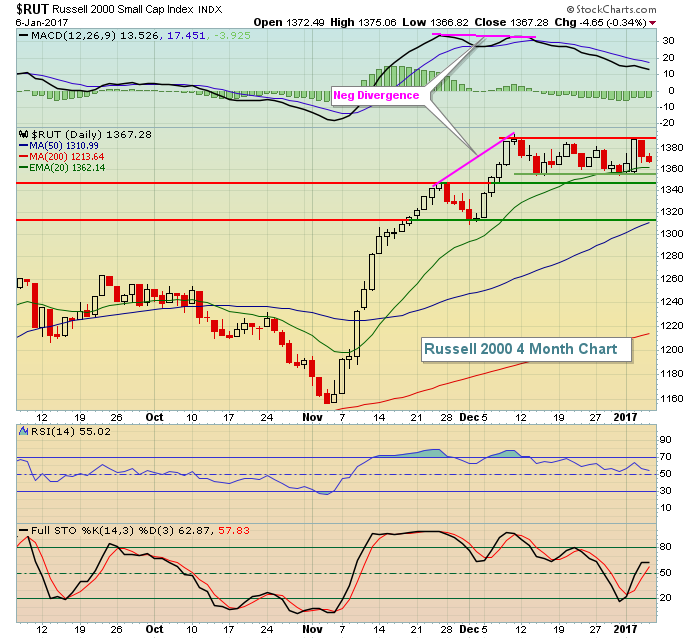 Notice also that the December low was very close to that 1311 level as well. In the historical tendencies section below, I point out that this week tends to be a week of profit taking so don't be surprised to see at least a test of the short-term support levels of 1347 and 1355, with a possible trip to 1311 if selling accelerates.
Sector/Industry Watch
The Dow Jones U.S. Railroads Index ($DJUSRR) appears poised for another breakout on its daily chart. We've seen tons of absolute and relative strength from railroads over the past several months and I'd look for more in early 2017. Here's the chart:
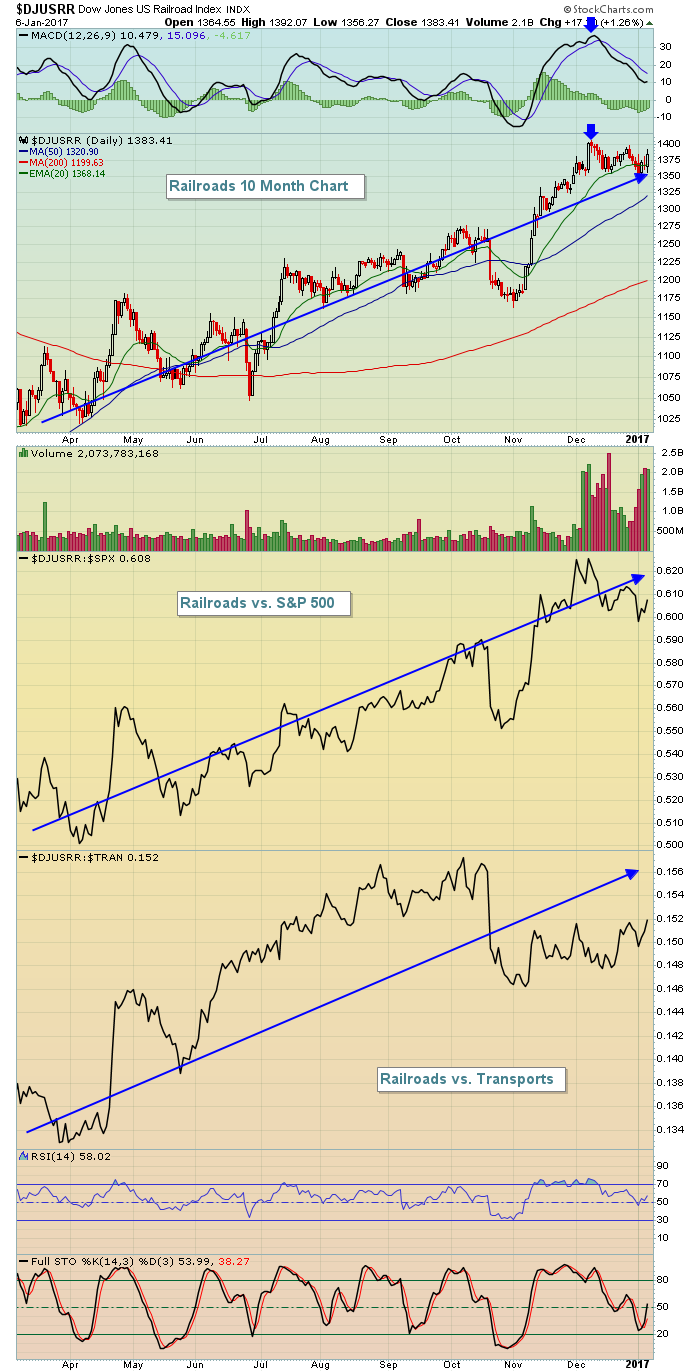 The strong bounce on Friday off its rising 20 day EMA may provide the fuel needed to another breakout here. The blue arrows highlight the momentum strength (new high on MACD) on the most recent price high. Technically, I look for support at the rising 20 day EMA with such strong momentum. After closing briefly beneath that 20 day EMA last Tuesday, the bulls have regained control with the strong finish Wednesday through Friday. A close above 1402 would be confirmation of the next breakout.
Monday Setups
I discuss many individual stocks during my 1pm EST Trading Places LIVE webinar, which is held for StockCharts.com members. If you're not currently a member, there are plenty of reasons to join, including all of the tools and features that you can utilize to trade smarter. But I'll give you two more. The first is I'd love to have you join me today at 1pm to discuss the first week of 2017 and look at several possible trading opportunities. The second is that Greg Schnell and I will be conducting a joint 2017 Stock Market Outlook webinar this Saturday, January 14, 2017 at 11am EST. It will be an information-packed webinar, and also likely to be quite entertaining!
CLICK HERE to start your 10 day FREE trial that will include that Saturday webinar. Then you can CLICK HERE to register for the event! Hope to see you there!
Here's one stock that I'll be discussing later during my Trading Places LIVE webinar:
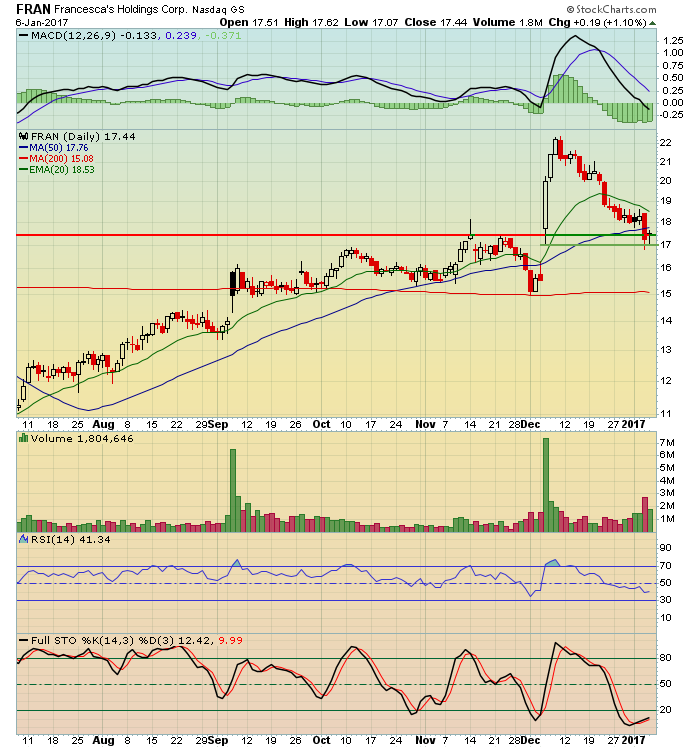 There was a huge technical breakout in early December on very heavy earnings-related volume and we've seen FRAN pull back over the past few weeks to hit a key area of gap support. Note that the RSI is now at 41 after being close to 80 after its earnings were reported. There's no guarantee that FRAN holds its gap support, but it's clear to me that the reward to risk is much, much better now.
Historical Tendencies
The Russell 2000 has produced annualized returns of -24.27% from January 7th through January 12th since 1987. I consider it a week of profit taking with key price support from 1347-1353 as reflected above in the Current Outlook section.
Key Earnings Reports
(actual vs. estimate):
AYI: 2.00 vs 2.06
GPN: .89 vs .80
(reports after close, estimate provided):
AA: (.17)
Key Economic Reports
None
Happy trading!
Tom
