Market Recap for Monday, January 23, 2017
Materials (XLB, +0.20%) and technology (XLK, +0.18%) were the leading sectors on Monday as our major indices traded in negative fashion throughout the day. The finish, however, was fairly strong as the S&P 500 finished in the upper end of its trading range. The S&P 500 managed to hold onto its 20 day EMA with an intraday low beneath it. Take a look:
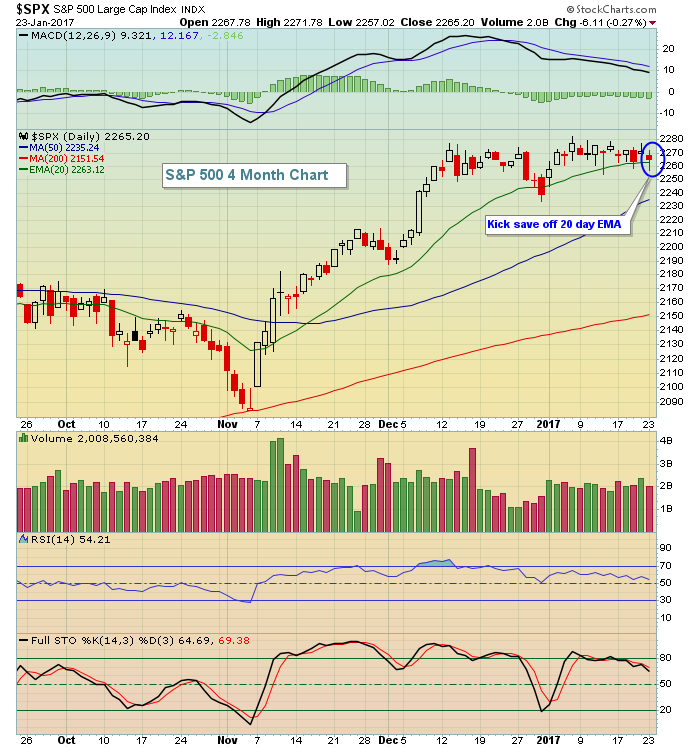 Technically, the recovery was nice, but the S&P 500 does continue to sport a negative divergence so a trip to the 50 day SMA - at a minimum - cannot be ruled out.
Internet stocks ($DJUSNS) helped to lead technology to the second spot in the sector leaderboard as this key aggressive industry group threatened highs set back in late October. Check this out:
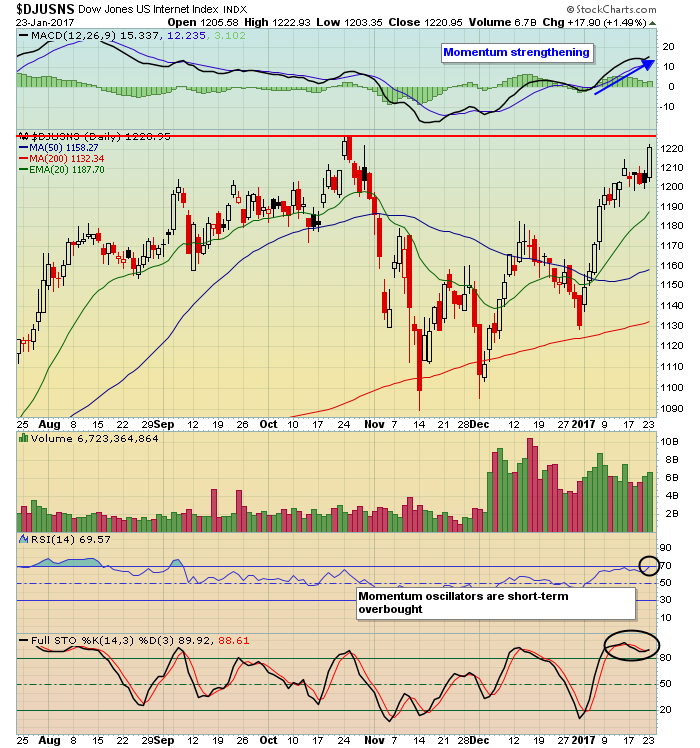 The DJUSNS has excellent momentum, but it is overbought as it approaches the 1228 price resistance level. I expect to see another breakout and Alibaba's (BABA) strong quarterly earnings report could be a catalyst today, but failure could lead to an unwinding of overbought conditions and perhaps a rising 20 day EMA test.
Pre-Market Action
No real clues are being provided this morning based on global markets. They're mixed across Asia and Europe and the U.S. market is flat with Dow Jones futures literally unchanged just 30 minutes or so from the opening bell.
Existing home sales will be released at 10am EST so perhaps that will give the consumer discretionary sector (XLY) some direction.
Current Outlook
Small cap stocks had been on fire during November and the early part of December, but have since cooled off. Take a look at the negative divergence that had printed at that time:
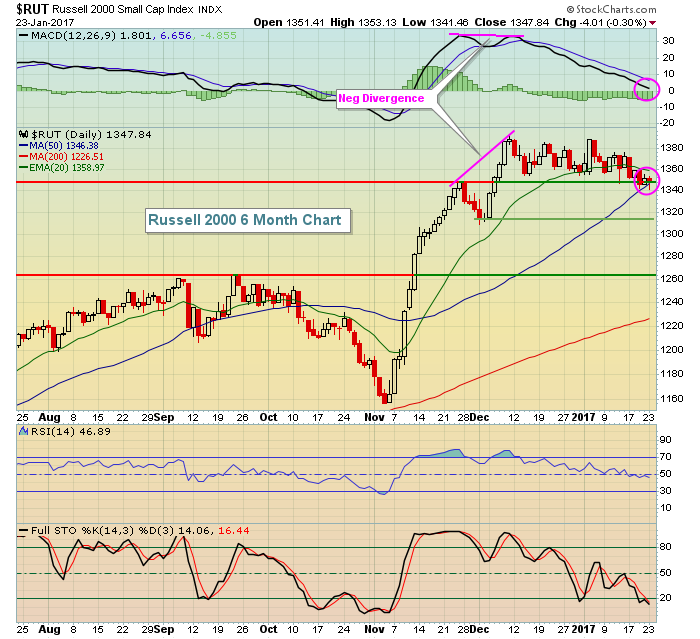 Notice a couple things here. I always look for a 50 day SMA test and/or a MACD centerline "reset" after a negative divergence prints. The pink circles highlight exactly that taking place. Also check out the RSI in early December near 80. After the consolidation has taken place, the RSI has dropped down to 47, a much more palatable area for entry into the small cap (Russell 2000) world. The green horizontal lines suggest next areas of key price support should the stock market weaken and the 50 day SMA not hold.
Sector/Industry Watch
The Dow Jones U.S. Airlines Index ($DJUSAR) was among the worst performing industry groups on Monday, but it makes sense technically as the DJUSAR hit critical price resistance at 280, testing its high from January 2015. Check it out:
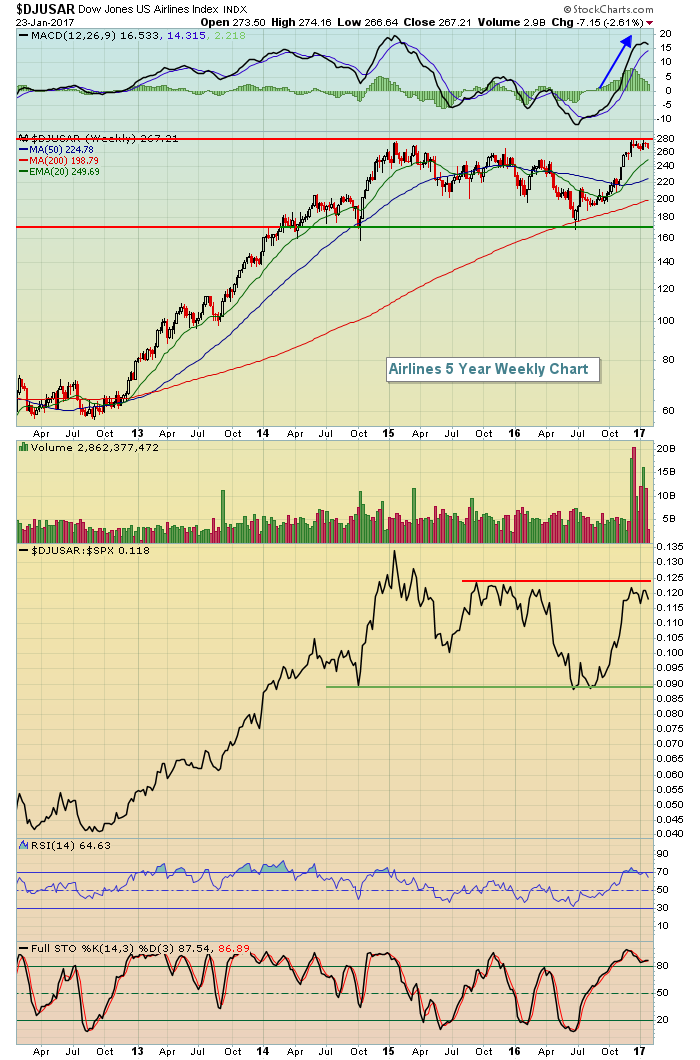 The good news is that weekly momentum remains very strong (blue directional line on MACD) and the DJUSAR is consolidating in sideways fashion after a prior rally. This typically results in a breakout rather than a breakdown.
Historical Tendencies
The period from January 27th through February 3rd is a bullish historical period dating back to 1950 on the S&P 500. It coincides with historical strength during the end and beginning of most calendar months. The end of calendar months typically rise in anticipation of money inflows at the beginning of the next calendar month, then the actual money comes in to drive prices higher. For the above period late-January to early-February, the S&P 500 has produced annualized returns of +38.93% over the last 67 years.
Key Earnings Reports
(actual vs. estimate):
BABA: 1.09 vs .85
DD: .51 vs .42
DHI: .55 vs .47
FITB: .48 vs .43
GLW: .50 vs .44
JNJ: 1.58 vs 1.56
KMB: 1.45 vs 1.42
LMT: 3.25 vs 3.04
MMM: 1.88 vs 1.87
SAP: 1.36 vs 1.10
TRV: 3.20 vs 2.89
VZ: .86 vs .89
WAT: 2.21 vs 2.13
(reports after close, estimate provided):
CA: .57
CNI: .92
COF: 1.60
DFS: 1.38
ISRG: 5.26
STLD: .43
STX: 1.07
SYK: 1.76
TSS: .65
TXN: .81
Key Economic Reports
December existing home sales to be released at 10:00am EST: 5,550,000 (estimate)
Happy trading!
Tom
