Note
First, I want to wish everyone a very happy new year! Second, I'm excited to announce that Greg Schnell (think Canadian Technician and Commodities Countdown) and I will be co-hosting a Stock Market 2017 Outlook webinar in mid-January where we'll compare notes and share our thoughts about investing and trading in 2017. It should be very educational, a bit opinionated and a whole lot entertaining so please prepare to join us. More details about this exciting webinar will be forthcoming here on the site so be on the lookout!
Market Recap for Friday, December 30, 2016
2016 ended in fitting fashion. There was much needed profit taking, a bit of technical tension and leadership by financials (XLF, +0.22%). Even a drop in the 10 year treasury yield ($TNX) on Friday beneath the TNX's 20 day EMA for the first time since late September could not deter the financial bulls. And they're being rewarded today as the TNX has jumped in early pre-market action 6.5 basis points. That should stimulate the financial sector once again.
But other sectors weren't so fortunate on Friday as eight of nine sectors declined, including both consumer discretionary (XLY, -0.84%) and technology (XLK, -0.78%), which were the biggest losers on the session. Technology is burdened by a negative divergence on its weekly chart, but it'll be interesting to see how this sector reacts if the bull market rages on in January. Why? Well, despite the slowing momentum on the weekly chart, the daily chart actually looks very solid so we could see further short-term strength before the longer-term issues kick in. Have a look at the daily chart on the XLK:
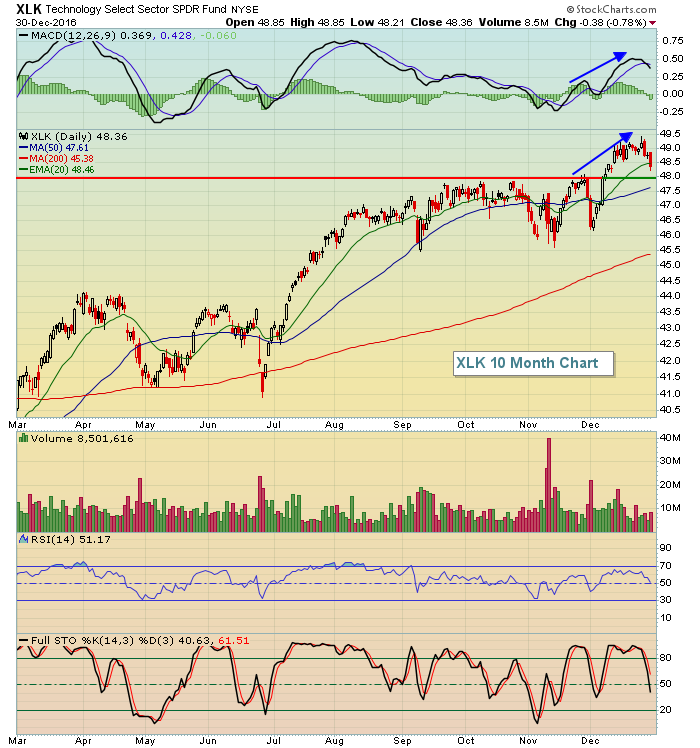 The blue trendlines show that as prices have been rising on the XLK in the near-term, short-term momentum continues to strengthen. So if price support at 48 continues to hold, the XLK has a decent shot of pushing higher in January, which would aid the bulls' attempt to take the market higher to open 2017.
Pre-Market Action
Crude oil prices ($WTIC) hit an 18 month high this morning and that's helped lead U.S. futures much higher to open the year. Dow Jones futures are higher by 124 points just a bit more than a half hour from the 2017 opening bell.
Asian shares were mixed, but the Hang Seng ($HSI) continued its recent strength, climbing overnight another 150 points and closing back above its declining 20 day EMA - a bullish sign indeed. In Europe, we're seeing a mixed action with Germany slightly lower after clearing significant price resistance at 11500 on Monday.
The 10 year treasury yield ($TNX) is higher this morning as traders ditch treasuries in favor of a continuing advance in U.S. equities. The TNX currently stands at 2.51% this morning, back above its 20 day EMA, a bullish technical development there.
Current Outlook
2016 was a crazy year technically as the debate between existing bull market and approaching bear market raged on throughout the year. Brexit was the topic of early summer and surely it felt like the market was rolling over and preparing for lower prices ahead. Many of the relative ratios that I follow were extremely weak and seemed to support the prospects of a bear market. So what did the market do? It promptly soared in late June and the first 2-3 weeks of July. Then the U.S. election process in October and early November seemed to be pointing to a certain Clinton victory and when President-elect Trump began to show strength in key battleground states, futures were crushed with the Dow Jones pointing to a potential 800 point drop. By morning, however, with a Trump victory nearly assured, markets recovered and another leg of the current market was ignited. While the in-the-moment technical selling appeared to be reversing the course of stock prices, the longer-term chart of the S&P 500 barely wavered as you can see below:
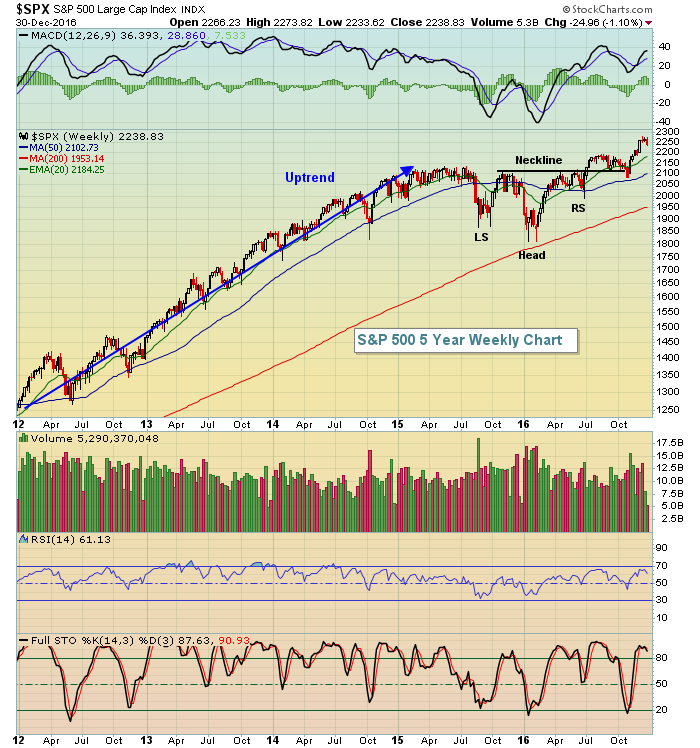 While we can get caught up in the day-to-day action and feel our emotions swinging, there's been very little on the long-term S&P 500 chart to worry about. In fact, the recent breakout of the bullish inverse head & shoulders continuation pattern suggests we'll see a measurement of close to 2400 before we'll need to re-evaluate. The measurement is determined by calculating the distance between the neckline (approx 2100) and the bottom of the inverse head (1812). By adding that distance of nearly 300 points to our 2100 neckline breakout area, our target of close to 2400 is determined. I'd remain patient and look for that target to be reached in 2017, possibly fairly early in 2017.
Sector/Industry Watch
Energy (XLE) remains one of my favorite industry groups for 2017 and it's mostly because of two things - the beating that energy shares sustained from mid-2014 to early-2016 when the XLE fell nearly 50%. It rose from its ashes a year ago and rising crude oil prices ($WTIC) will likely be the second catalyst for further gains in 2017. Technically, the WTIC has a similar long-term bullish head & shoulders pattern in play that should help to "fuel" the S&P 500 rally in 2017. I've posted this multiple times in the past, but let's take another look as a reminder:
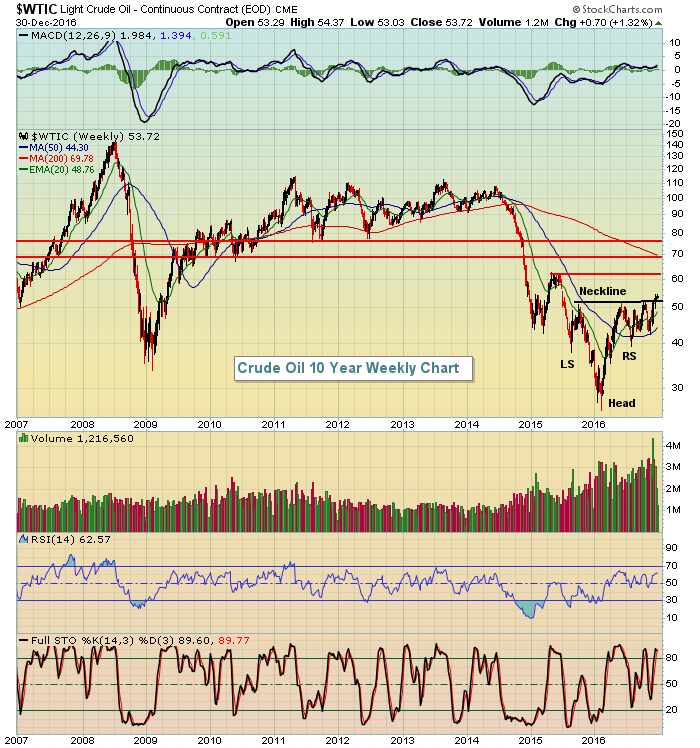 The reverse head & shoulders pattern potentially marks a bottom, but requires a neckline breakout to confirm, which we've seen. This pattern breakout measures to the $75-$80 per barrel range and I've marked above the three key levels of price resistance I'm watching. I fully expect the first level of $62 per barrel to be tested - probably sooner rather than later. Crude oil to $62 per barrel would be huge for the energy sector and it's a key factor in overweighting the sector to begin 2017.
Historical Tendencies
As we begin a brand new trading year and we ponder the prospects for 2017, keep in mind there are historical precedents that we must always remember. Namely, there is a 12 consecutive calendar day stretch where nearly all of the S&P 500 gains have taken place since 1950. It's from the 25th of one month at the close to the 6th of the next month at the close. Take a look at how these two periods have performed in terms of annualized performance. Also, I've included how many trading days this analysis covers in parenthesis:
26th through 6th: +20.58% (covers 6180 trading days, or the equivalent of 24.43 yrs)
7th through 25th: +2.39% (covers 11097 trading days, or the equivalent of 43.86 yrs)
Key Earnings Reports
None
Key Economic Reports
December ISM manufacturing index to be released at 10:00am EST: 53.8 (estimate)
November construction spending to be released at 10:00am EST: +0.6% (estimate)
Happy New Year and Happy Trading!
Tom
