Market Recap for Tuesday, February 7, 2017
The Dow Jones moved into blue sky, all-time high territory intraday on Tuesday as it touched 20155. If there was any bad news, it's that the move didn't hold into the close as the Dow came up 10 points short of closing at an all-time high. Still, there's clearly a bid under the market and any type of selloff is difficult to sustain.
Consumer staples (XLP, +0.82%) was the clear leader yesterday as tobacco stocks ($DJUSTB) extended their recent strength and closed at yet another all-time high. You could say that tobacco is smoking hot right now given their strong momentum. Check out the chart:
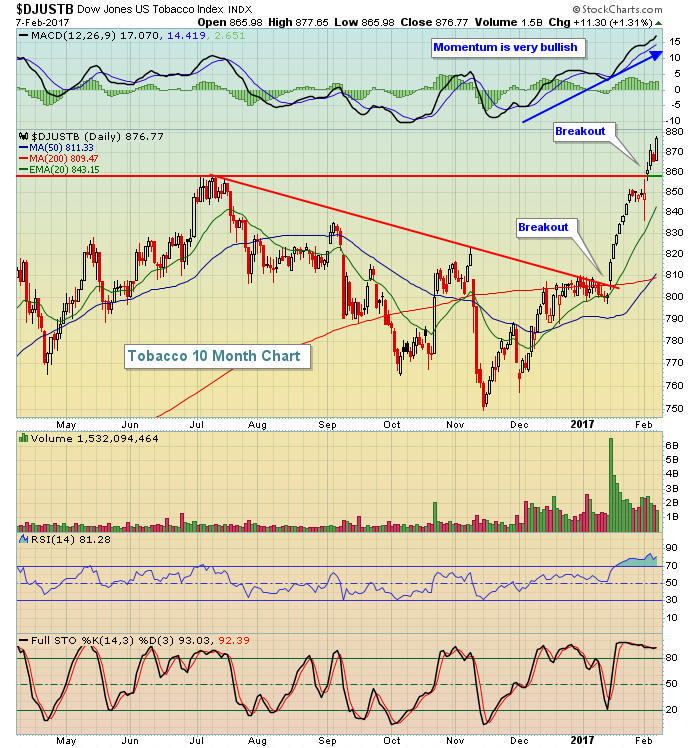 We're seeing breakout after breakout in this group on very heavy volume and the price momentum (MACD) is extremely bullish as well.
Consumer staples were not alone in terms of leadership. Technology (XLK, +0.39%) also was strong as this sector closed at another all-time high.
Pre-Market Action
30 minutes prior to the open, Dow Jones futures are down about 20 points, looking to extend some of the weakness we saw on Tuesday after the strong open. Keep in mind that historically we are in the 7th to 10th of the calendar month where it's not unusual at all to see some profit taking.
The 10 year treasury yield ($TNX) is back down to 2.36% this morning as money remains slightly defensive as U.S. equities mostly consolidate. The range on the TNX remains roughly 2.30% to 2.60% for now.
Overnight, Asian markets were mostly higher while we're seeing the opposite in Europe with most markets there down fractionally this morning. Crude oil ($WTIC) has dipped back below $52 per barrel.
Current Outlook
Historically, December is the best month of the year for the Russell 2000 ($RUT), but March has also been very strong over the past two decades. Currently, the Russell 2000 is consolidating the December gains. If we don't see another breakout in the RUT in February, then March could once again be a very strong month for small cap stocks. The RUT is in a bullish bull flag pattern and awaiting its next breakout. Take a look:
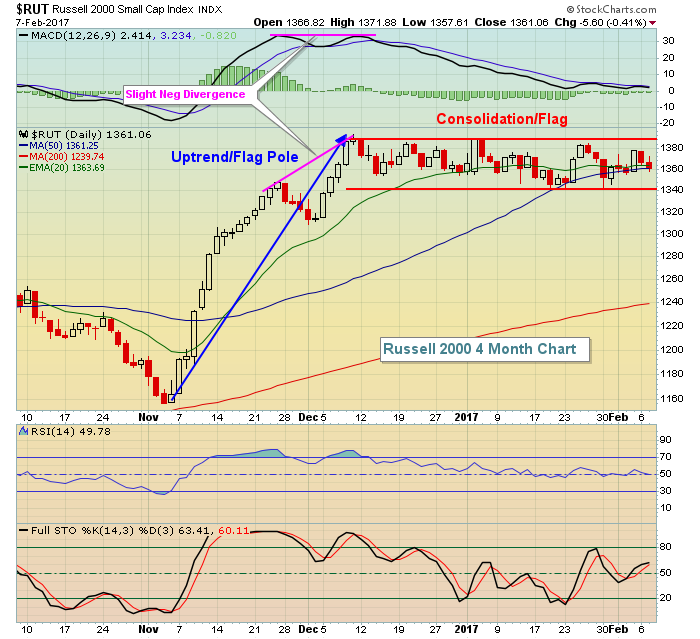 The lines - both support and resistance - are apparently drawn so we'll see which level breaks first. The Russell 2000 did have slowing momentum so the current period of consolidation was not unexpected. The MACD, however, is now back at centerline support so momentum is no longer an issue.
Sector/Industry Watch
One look at the Dow Jones U.S. Brewers Index ($DJUSDB) and you might need a drink. While the overall U.S. market has soared since early November, the DJUSDB has been heading in the opposite direction. Since mid-October, the DJUSDB has fallen from 1193 to yesterday's close of 1010. That's approximately a 15% drop during a raging bull market. Hhhhmmmmmm.
The current bear flag is a technical problem to boot, check it out:
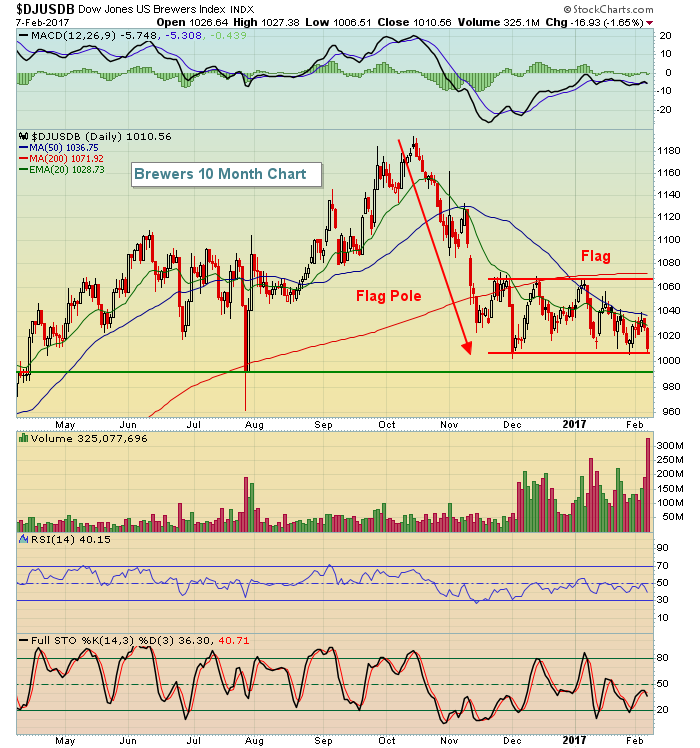 The current trading range in this bear flag pattern is 1005-1070. Because the prior trend is down, the highest probability is a break to the downside. I would be very careful if the support level breaks on increasing volume.
Historical Tendencies
The Dow Jones U.S. Clothing & Accessories Index ($DJUSCF) has been the worst performing industry group within the consumer discretionary sector over the last month. But we know that money rotates during bull markets so the question begs whether it's now time for this group to shine. History would suggest it is based on the following seasonality chart:
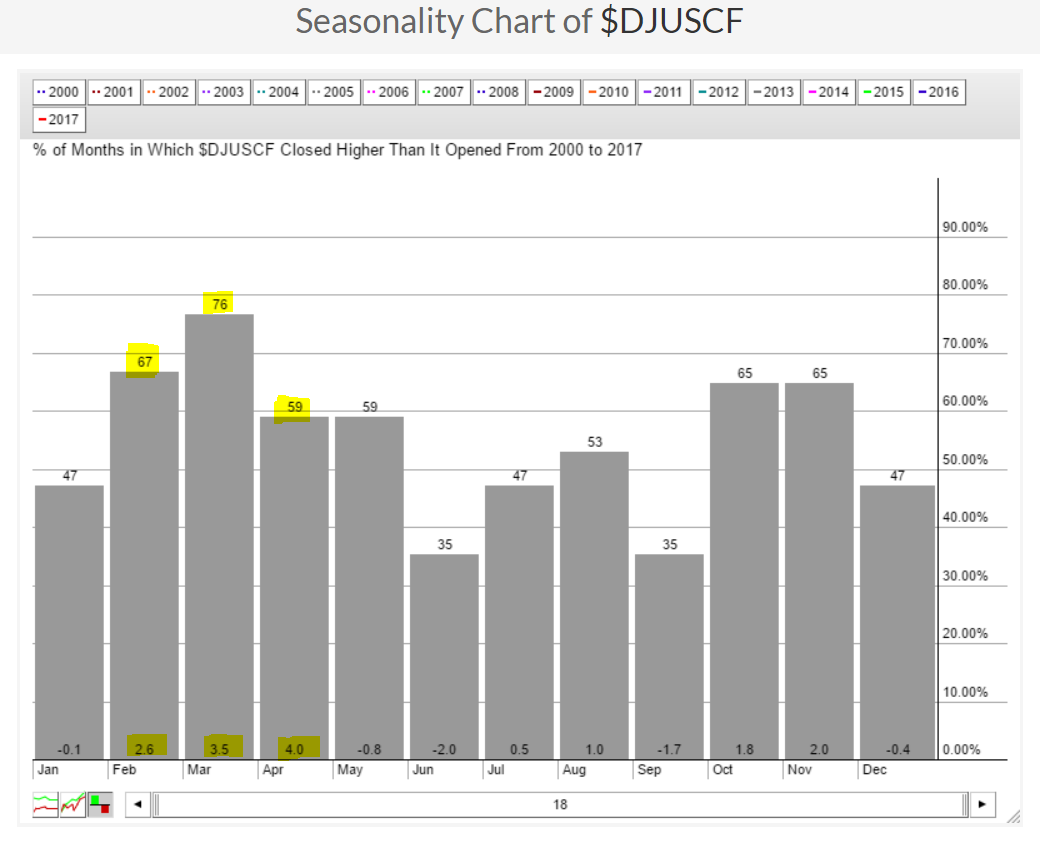 The three best months of the year for clothing & accessories just happens to be the consecutive months from February through April. I'm not sure if history alone will turn things around for this industry group as it is now approaching lows not seen since mid-2012, but I suppose it can't hurt.
Key Earnings Reports
(actual vs. estimate):
ABB: .33 vs .27
AGN: 3.90 vs 3.79
ALK: 1.56 vs 1.41
CTSH: .76 vs .77
EXC: .44 vs .45
GT: .95 vs .86
HUM: 2.09 vs 2.06
ITUB: .27 vs .26
JEC: .68 vs .63
SNY: .67 vs .67
TWX: 1.25 vs 1.19
(reports after close, estimate provided):
CTL: .56
EFX: 1.38
FISV: 1.16
LVLT: .44
PRU: 2.31
SU: .21
TRMB: .26
WFM: .40
Key Economic Reports
None
Happy trading!
Tom
