Market Recap for Monday, February 13, 2017
Recent leadership from financials (XLF, +1.14%) and industrials (XLI, +1.00%) appears to be resuming as these two groups led the benchmark S&P 500 to fresh all-time highs on Monday. The last week has been very strong for U.S. equities and it's very bullish to watch industrials (+2.62% over the past week), consumer discretionary (XLY, +1.89%) and financials (XLF, +1.86%) lead the march higher. While you might be upset that technology is not among the leaders, you really shouldn't fret. History tells us that technology does not lead the stock market in the February to April time frame. Check out the following seasonality chart that shows relative weakness in the XLK vs. the benchmark S&P 500:
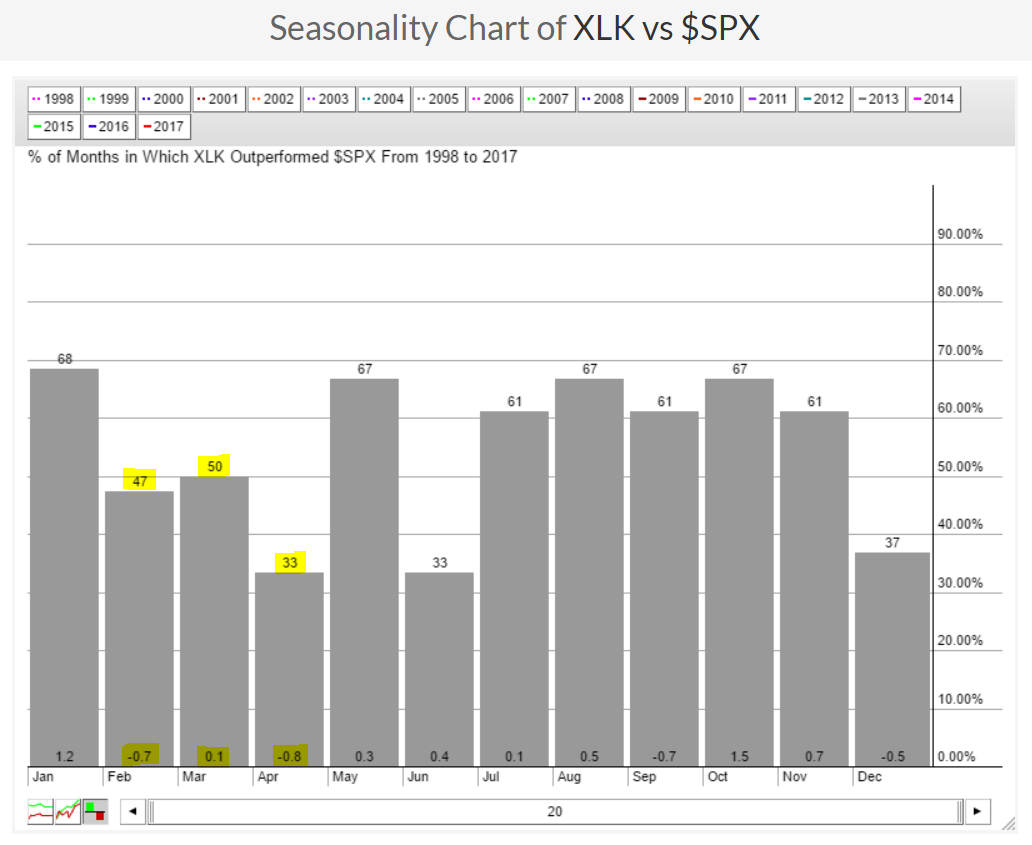 Based on the above, don't expect much leadership from technology stocks. Instead, from a seasonal perspective, February through April is typically dominated by consumer discretionary (XLY) and energy (XLE). Those two sectors, along with the current technical strength in financials and industrials, is where I'd focus my trading efforts.
Having said that, consumer stocks were the weakest sector links on Monday, barely participating at all. Automobiles ($DJUSAU), however, did buck the consumer discretionary weakness and tack on 1.49% gains on the session, led by very strong gains in Tesla (TSLA).
Pre-Market Action
We're 30 minutes from the opening bell here in the U.S. and Dow Jones futures are about as flat as they could be - up 1 point - following the lead in Europe where we see most of the major indices flat as well. While the major indices here have been closing at all-time highs on a regular basis, the key index in Europe - the German DAX ($DAX) - is strong but still trying to clear late January highs. I point out the DAX as being the key index in Europe because it has the strongest correlation to the S&P 500 over the past couple decades.
Richmond Fed President Jeffrey Lacker said the Fed should raise interest rates sooner rather than later and we'll hear from Fed Chair Janet Yellen later this morning. Lacker's comments have had little impact in the treasury market as the 10 year treasury yield ($TNX) is higher by less than 1 basis point this morning.
Current Outlook
For today's outlook, I'm going to point you to a couple of video recordings to review at your leisure. I pointed out several reasons in my Bowley Briefing webinar
First is a joint webinar that I co-hosted with Greg Schnell on Saturday, February 11th. Greg discussed the biotech group and the bullish possibilities upcoming there. He also spent time discussing the use of ChartLists, one of the great tools/features of a StockCharts membership. I use ChartLists every day in my trading. It's a great way to keep track of and organize potential trades in the days ahead. Honestly, it helps to take much of the emotion out of trading. You simply trade what you see. My discussion on Saturday revolved around trading gaps - especially gaps created by solid earnings reports. Here's the link to watch the video:
https://stockcharts.com/webinars/archives/?id=22571 (SC members only)
Next up are my two webinars from yesterday. The first was Monday's Bowley Briefing where I discussed reasons why the current rally is sustainable in my view:
https://stockcharts.com/webinars/archives/?id=19378 (available to all SC users)
The second video is pending so I'll look to provide a link tomorrow, but the purpose of this webinar was to show how the "under the surface" signals back at the market top in 2007 were so much different than they are today.
For those interested in viewing the members only webinars, simply use the link below to get your 10 day FREE trial:
https://stockcharts.com/sales/new.html
Sector/Industry Watch
The Dow Jones U.S. Airlines Index ($DJUSAR) led industrials on Monday and are nearing another significant breakout at the 280 level. This is obviously a key level on a daily chart, but it's also big on a longer-term weekly chart. It appears that we're testing the upper resistance within a sideways consolidation pattern after a prior uptrend:
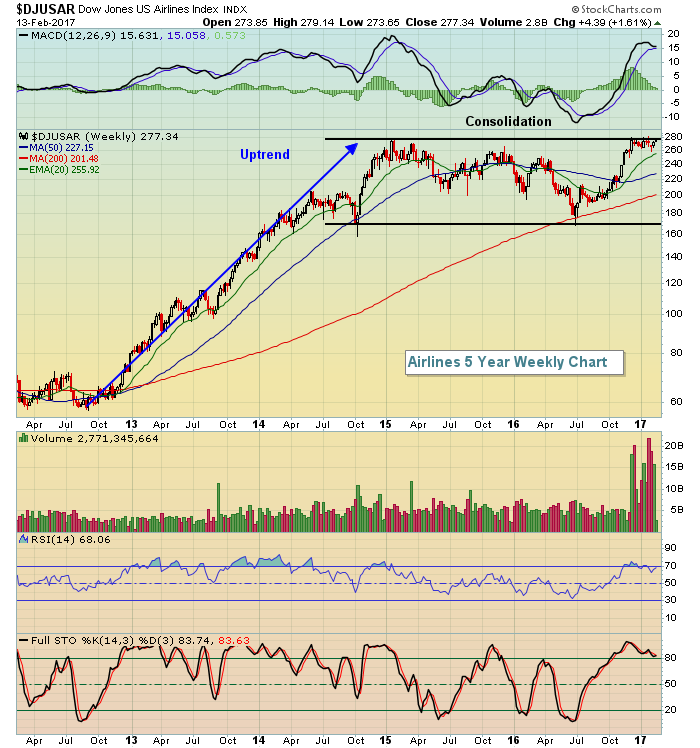 A close above 280 would be a very strong buy signal for this group and would also suggest global economic strength in the weeks and months ahead.
Historical Tendencies
February is home to Valentine's Day and chocolates. So perhaps it's not too surprising that Hershey's (HSY) performs so well during this month. But the returns are spectacular. HSY has risen during February 19 times in the last 20 years with an average monthly gain of 4.4%. On its seasonality chart, February really stands out:
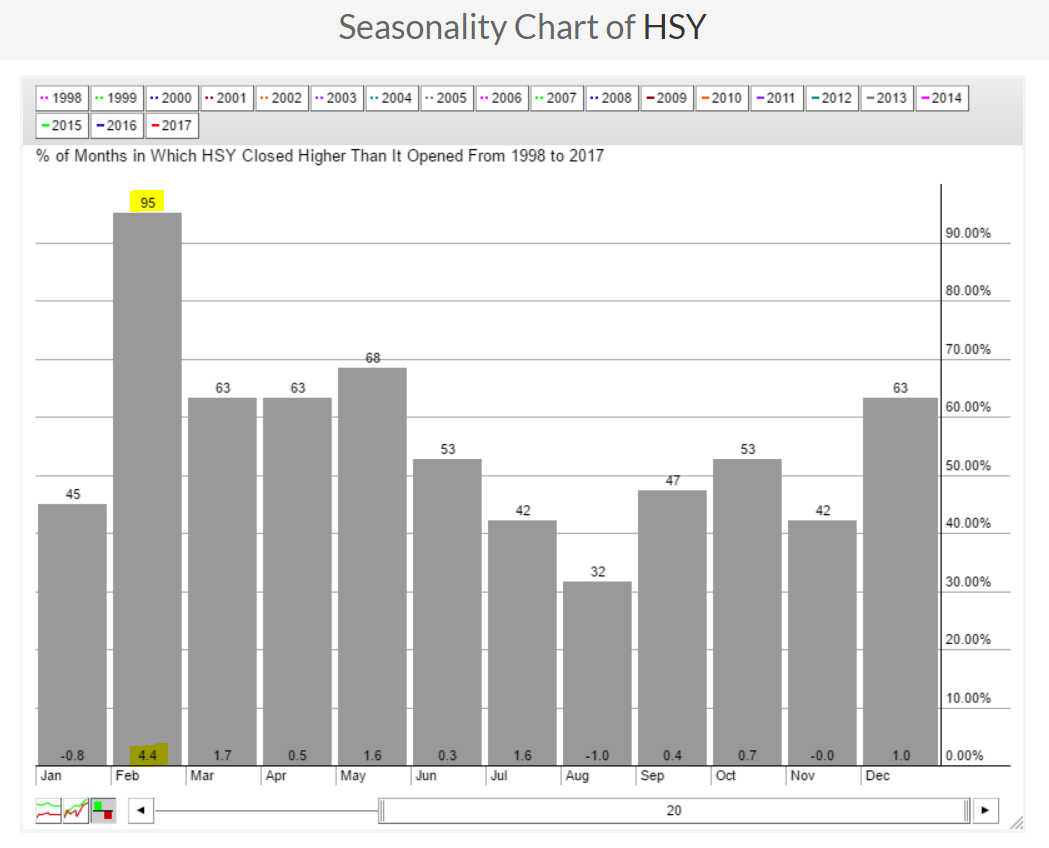 I suppose it shouldn't be too surprising then that HSY is up 2.6% halfway through February 2017.
Key Earnings Reports
(actual vs. estimate):
DISCA: .56 vs .51
DPS: 1.04 vs 1.06
INCY: .15 vs .14
MLM: 1.55 vs 1.65
NBL: .26 vs (.09)
TMUS: .45 vs .29
(reports after close, estimate provided):
A: .49
AIG: 1.24
DVN: .19
ESRX: 1.87
Key Economic Reports
January PPI released at 8:30am EST: +0.6% (actual) vs. +0.3% (estimate)
January Core PPI released at 8:30am EST: +0.4% (actual) vs. +0.2% (estimate)
Happy Valentine's Day and happy trading!
Tom
