Market Recap for Monday, February 6, 2017
Please be sure to subscribe to my blog at the bottom of this article and all of my articles will be sent to your e-mail address as soon as they're published. Thanks! :-)
It's noteworthy to point out that Apple (AAPL) closed above 130 per share for the first time in its history yesterday. While that didn't exactly light a fire under technology stocks (XLK, +0.06%), we did see outperformance from the group and certainly benefited the computer hardware group ($DJUSCR), which gained 0.72% and closed at 1846, just four points beneath its all-time closing high of 1850, established two years ago. Check out this longer-term weekly chart:
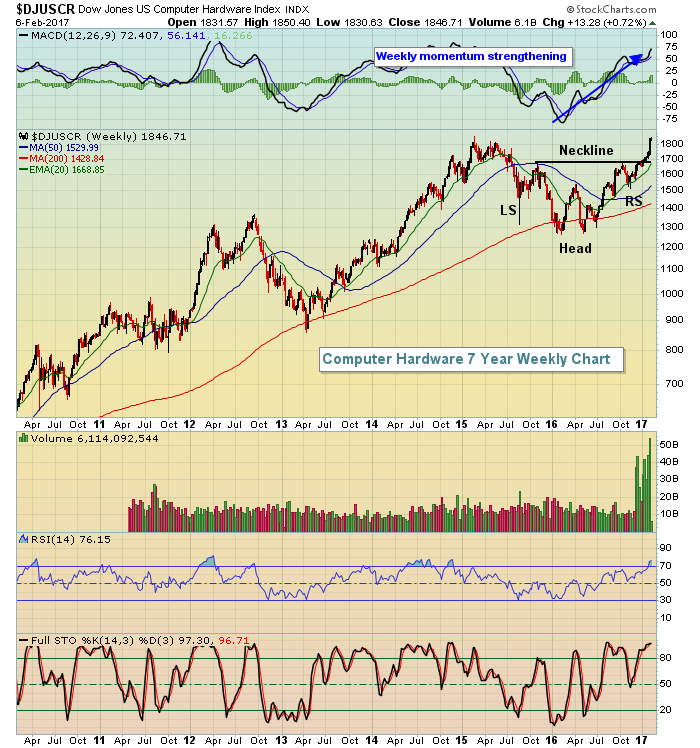 Momentum remains very strong in this space so I'd look for the measurement of the inverse H&S pattern to eventually be reached and that is near the 2100 level. I could also argue that the right side of a cup just formed so a handle back to test the rising 20 day EMA would complete that pattern and an eventual heavy volume breakout would measure to 2350 or so. The point here is there are bullish patterns in play no matter how you slice it and AAPL's latest breakout only adds to the bullishness.
The energy sector (XLE, -0.84%) continues to be the weakest link of late as crude oil prices ($WTIC) fluctuate between $50 and $55 per barrel. I'm fine with the consolidation but a break in crude oil back beneath $49-$50 would present technical issues for sure.
Pre-Market Action
Gold ($GOLD) is down slightly this morning to 1230, but clearly has made another breakout in recent days and that strengthens its short-term outlook. I have not been a fan of gold, but I do recognize that holding rising 20 day EMA with a subsequent breakout to fresh new recent highs is bullish. So long as that rising 20 day EMA holds and the MACD keeps climbing, it's difficult to be bearish near-term.
Dow Jones futures are up in pre-market action, rising 59 points with less than an hour to go to the opening bell. That follows strength in Europe this morning as the German DAX ($DAX) again bounces off its 10500 price support. Asia was lower overnight, but just fractionally so.
Current Outlook
History suggests that the health of a stock market rally is only as good as the strength of aggressive areas during that rally. In the chart below, you can see that during significant rallies and breakouts in our benchmark S&P 500, there's generally a corresponding rally and breakout in the XLY:XLP (consumer discretionary vs. consumer staples), the $TRAN:$UTIL (transports vs. utilities) and the $RUT:$SPX (Russell 2000 vs. S&P 500). The first ETF/index listed is the more aggressive so if the ratios are rising, it's evidence that traders are in "risk on" mode and that's bullish. Look at this chart:
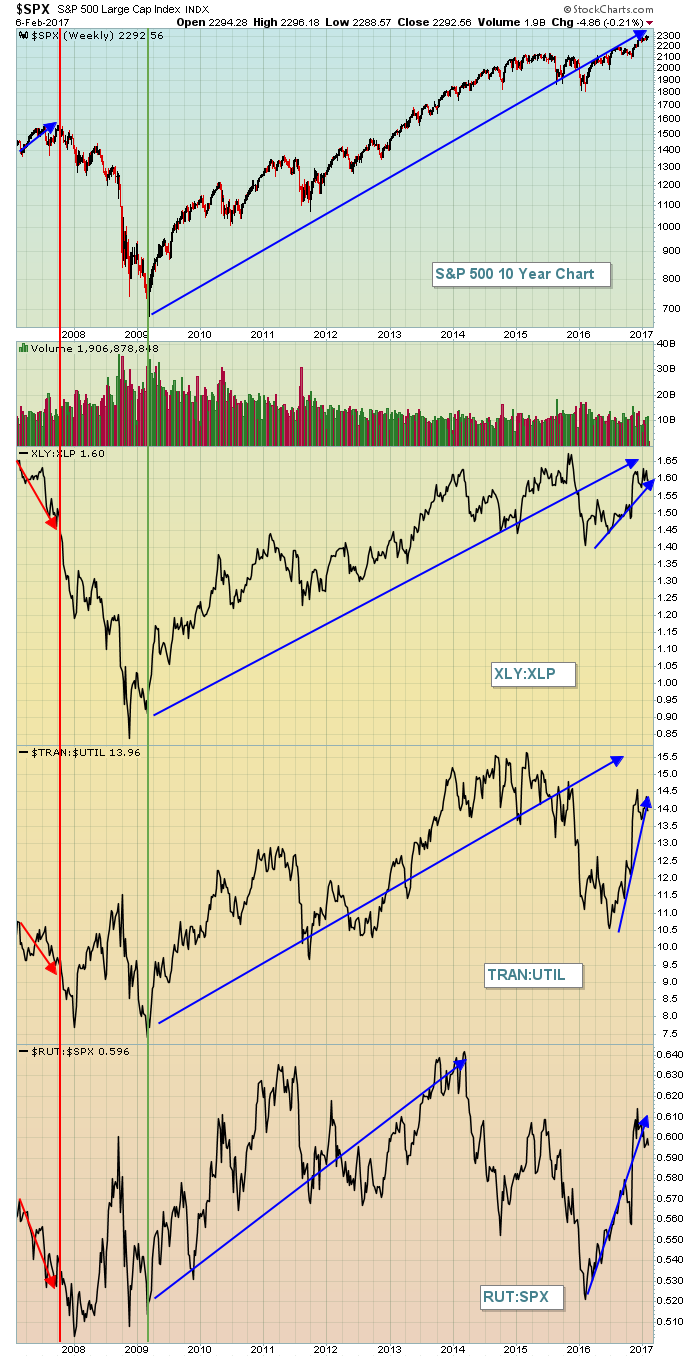 Check out a couple things on this chart. First, focus on that red vertical line. That marked the top in 2007. Just prior to that top, the benchmark S&P 500 was rising and all three of the relative ratios featured above were declining. That tells us that defensive stocks were leading that final fateful rally. As we fast forward through the bull market, you can see that the relative ratios were mostly climbing. There were definitely "beneath the surface" caution flags waving during parts of 2014 and 2015, but we never saw major breakdowns in the S&P 500. Throughout much of 2016 as the S&P 500 was climbing, the blue arrows show that money was rotating powerfully into aggressive areas and that is quite bullish in my view. I'd grow much more cautious if the S&P 500's rally turned to defensive areas for leadership.
Remain bullish for now.
Sector/Industry Watch
The Dow Jones U.S. Internet Index ($DJUSNS) is one of the more aggressive areas of the stock market and is important to the sustainability of the current rally as it's been one of the leaders. Action lately in this space has been bullish with the latest good news being the bounce off of its rising 20 day EMA. Have a look:
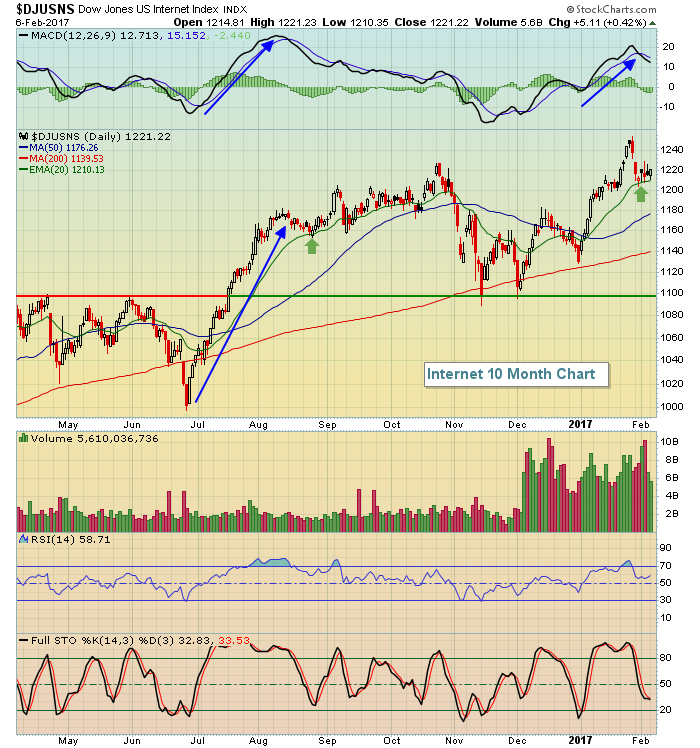 Note that during the last parabolic move higher and breakout by the DJUSNS, it was followed by a period of consolidation and a test of the rising 20 day EMA - exactly what I look for after an extended advance and a healthy MACD. That's approximately where we are right now with this group - testing its rising 20 day EMA after an extended advance. Please keep in mind that technical analysis does not provide guarantees, it simply provides us advantages in managing risk.
Historical Tendencies
priceline.com (PCLN) has a very bullish cup with handle in play. Before I get into the historical bullishness of the stock, check out the technical picture:
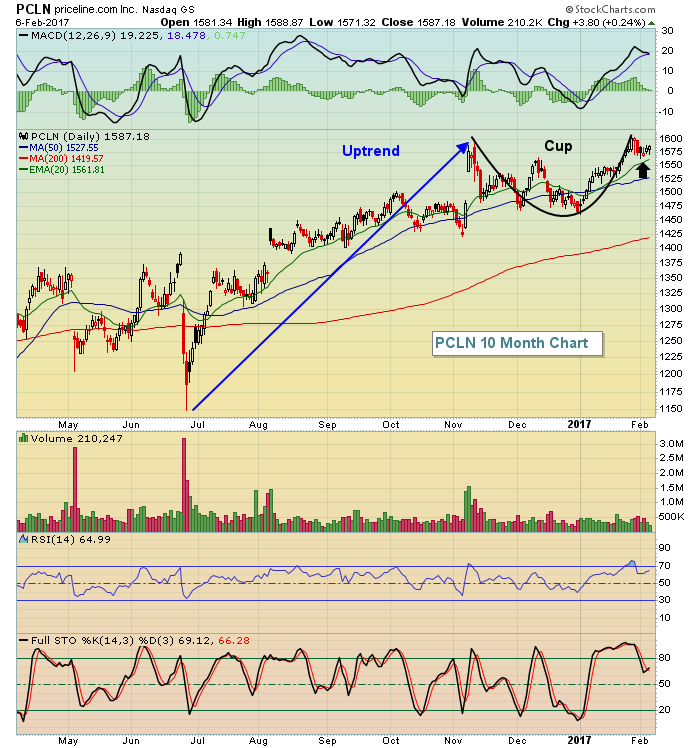 It's showing a very bullish cup and the breakout above 1600 accompanied by confirming heavy volume would measure to 1740. But that's just the beginning of the story with PCLN. Take a look at how PCLN has performed from February through April over the past 19 years:
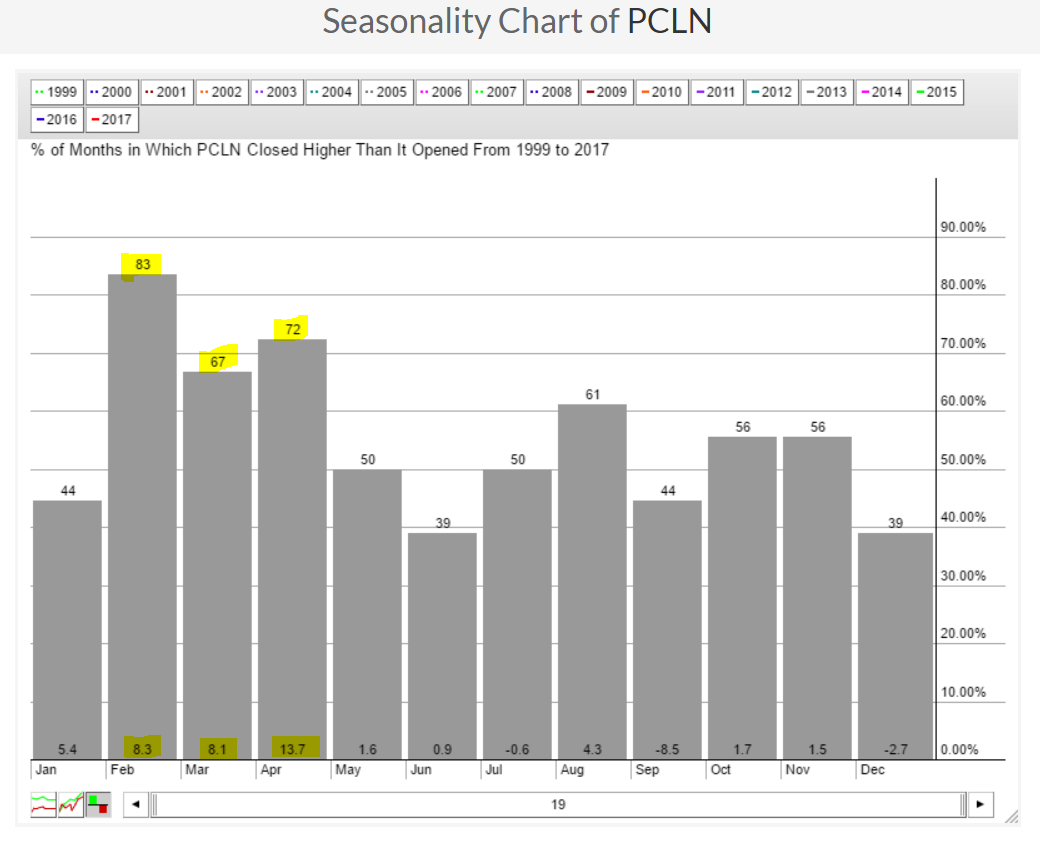 Technical patterns and historical tendencies are both lining up for this travel company.
Key Earnings Reports
(actual vs. estimate):
ADM: .75 vs .80
AME: .58 vs .58
BP: .13 vs .16
CAH: 1.34 vs 1.24
CHD: .44 vs .42
CNC: 1.19 vs 1.12
EMR: .49 vs .43
FIS: 1.14 vs 1.14
GM: 1.28 vs 1.14
ICE: .71 vs .69
KORS: 1.64 vs 1.62
LII: 1.50 vs 1.40
MOS: .26 vs .12
NOV: (.15) vs (.29)
OMC: 1.47 vs 1.45
SPGI: 1.28 vs 1.20
STO: (.02) vs .17
TDG: 2.45 vs 2.27
VMC: .69 vs .83
WCG: 1.03 vs .53
(reports after close, estimate provided):
AKAM: .53
DIS: 1.48
GILD: 2.31
MCHP: .81
MDLZ: .49
ORLY: 2.54
PXD: .31
Key Economic Reports
None
Happy trading!
Tom
