Market Recap for Thursday, February 16, 2017
U.S. indices finished in bifurcated fashion on Thursday as the Dow Jones logged gains, the S&P 500 finished flat and the NASDAQ and Russell 2000 both finished with minor losses. We could see some additional weakness in coming days based on very overbought conditions and historical bearishness during the upcoming week in February. More on that below.
Utilities (XLU, +1.00%) were the best performing sector as the 10 year treasury yield ($TNX) fell 5 basis points. That sent traders into the high-yielding utilities space with the XLU closing at a 4 1/2 month high. If we do see additional selling in U.S. equities near-term, I'd expect to see further leadership from the XLU during this period. Technology (XLK, +0.23%) and industrials (XLI, +0.03%) could suffer under such a scenario as both of these sectors are very overbought in the near-term.
Energy (XLE, -1.36%) was again weak and continues to underperform the benchmark S&P 500, but it appears as though the XLE is nearing key support (see the Sector/Industry Watch section below). Consumer discretionary (XLY, -0.51%) was also a laggard on Thursday as gambling stocks ($DJUSCA) were hit particularly hard, dropping 4.19%.
Homebuilders ($DJUSHB) are a group I'm watching closely as key 610-620 resistance is approaching once again. I'd like to see a high volume breakout in this group to confirm the current bullish pattern. Here's the chart:
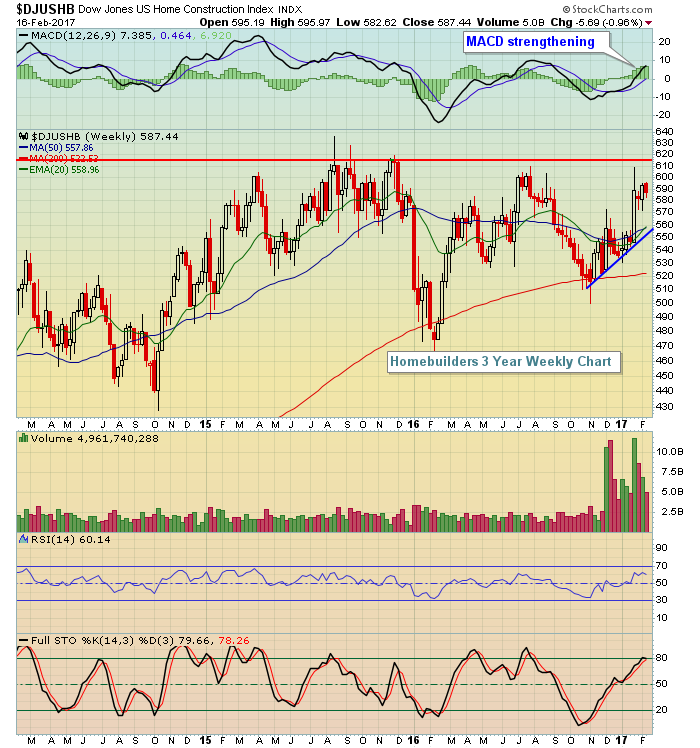 There have been multiple attempts at a breakout here without any success. Homebuilding stocks breaking out would reflect a lot of confidence in an improving economy throughout 2017.
Pre-Market Action
Deere & Co (DE) posted a notable earnings beat this morning with its lastest quarterly EPS of $.61 (Wall Street consensus estimates were $.51). Revenue came in $50 million ahead of estimates as well. While I wouldn't chase this morning's gap higher (up 3.5% at last check), DE remains a very solid stock and could be bought on 20 day EMA tests in the coming days/weeks for a trade. It'll definitely be a stock that I add to my Strong Earnings ChartList.
Global markets are weak. Overnight, Asian markets were mostly lower with the China Shanghai ($SSEC) down nearly 1%. In Europe this morning, the French CAC ($CAC) is down just over 1%. Dow Jones futures are down in sympathy, losing 72 points 30 minutes before today's opening bell. Overbought conditions, rotating sector strength and historical tendencies could be problematic for U.S. stocks in the near-term. I don't really see longer-term issues, however, so short-term weakness should be viewed as an opportunity to enter with a better reward to risk opportunity.
Current Outlook
Historically, the S&P 500 struggles over the next week or so. A few days ago, I posted historical tendencies regarding this upcoming week with regard to the NASDAQ. You can CLICK HERE for the article and then simply scroll down to the Historical Tendencies section. The S&P 500 is also bearish during this period. The only difference is that on the S&P 500, the bearish period extends one more day through February 23rd. This eight day period (Feb 16 through Feb 23) has produced annualized returns of -16.10% since 1950 on the S&P 500. Given the overbought conditions in the U.S. market, a pullback would actually provide some short-term relief and would be a good thing technically, while following historical tendencies as well. Take a look at the current overbought conditions:
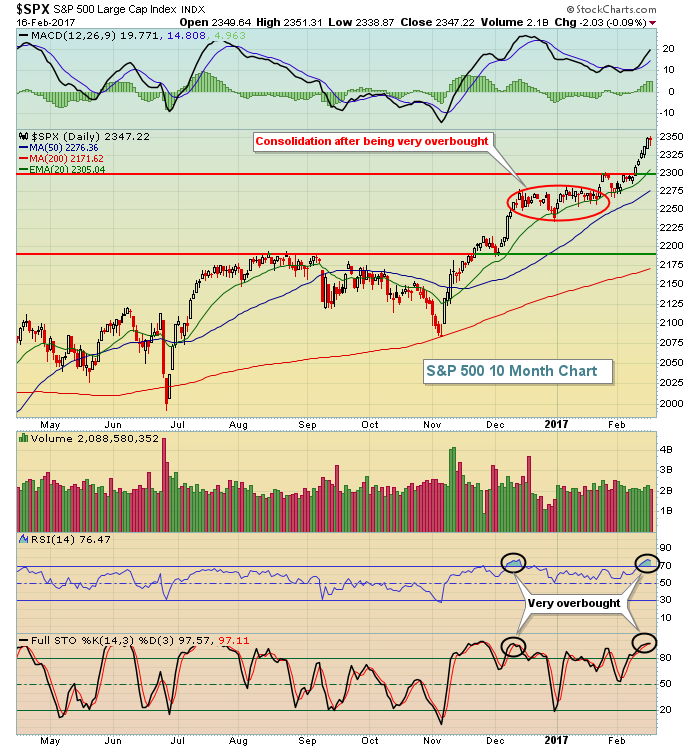 Keep in mind that an overbought market can remain overbought for an extended period so I'm not trying to argue for a guaranteed selloff. Instead, you should simply consider the current market ripe for some profit taking and recognize that entering new positions currently carries more risk.
One other consideration: the S&P 500 is overbought on its weekly chart (weekly RSI is at 72) for the first time since June 2014. Three months later, the S&P 500 was down 10%. I don't believe we'll see that this time - mostly because weekly momentum is very strong right now. However, selling down to the rising 20 week EMA, currently at 2243 (approximately a 5% drop) can't be ruled out.
Sector/Industry Watch
Energy (XLE) hasn't broken down, but it continues to threaten trendline and 20 week EMA support. It was the worst performing sector on Thursday and it's been the worst performing sector over the past week, month and three month periods. Historically, the XLE has been one of the best relative performers from the period February through April so I'm giving the group a reasonable shot of bouncing off support. But we'll know soon enough as you can see from the chart below:
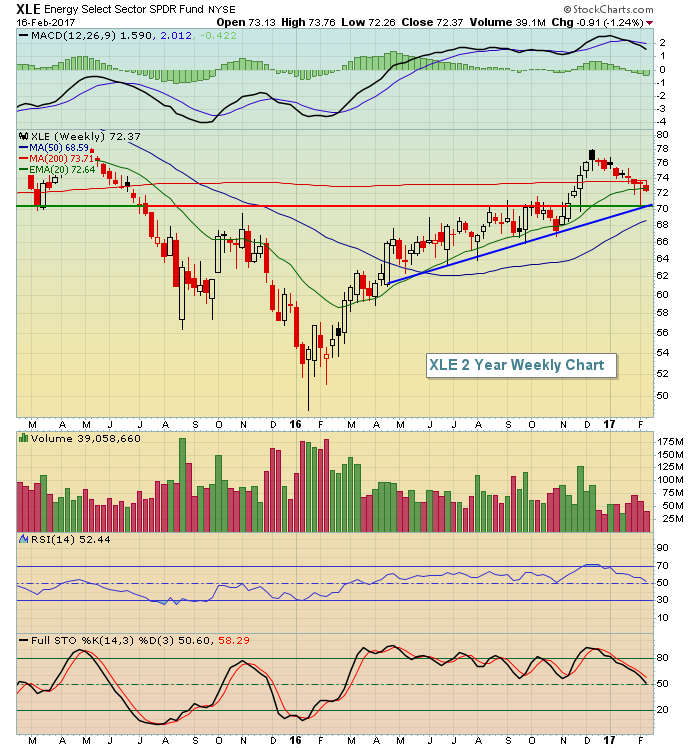 Currently, the XLE is just beneath its rising 20 week EMA, but remember this is a weekly chart so the final candle prints today. I view the 70-72 support area as critical from a weekly perspective. A weekly close beneath 70 would begin to look much more bearish, especially if volume is high and suggests distribution. Also note that the weekly RSI had moved above 70 on the most recent price high, but now that we've seen profit taking, support is approaching and the weekly RSI is back closer to 50. The reward to risk entry into the XLE has most definitely improved. (Disclosure: I own XLE shares)
Historical Tendencies
As a refresher, the following seasonality chart highlights the historical outperformance of energy (XLE) during the next couple months:
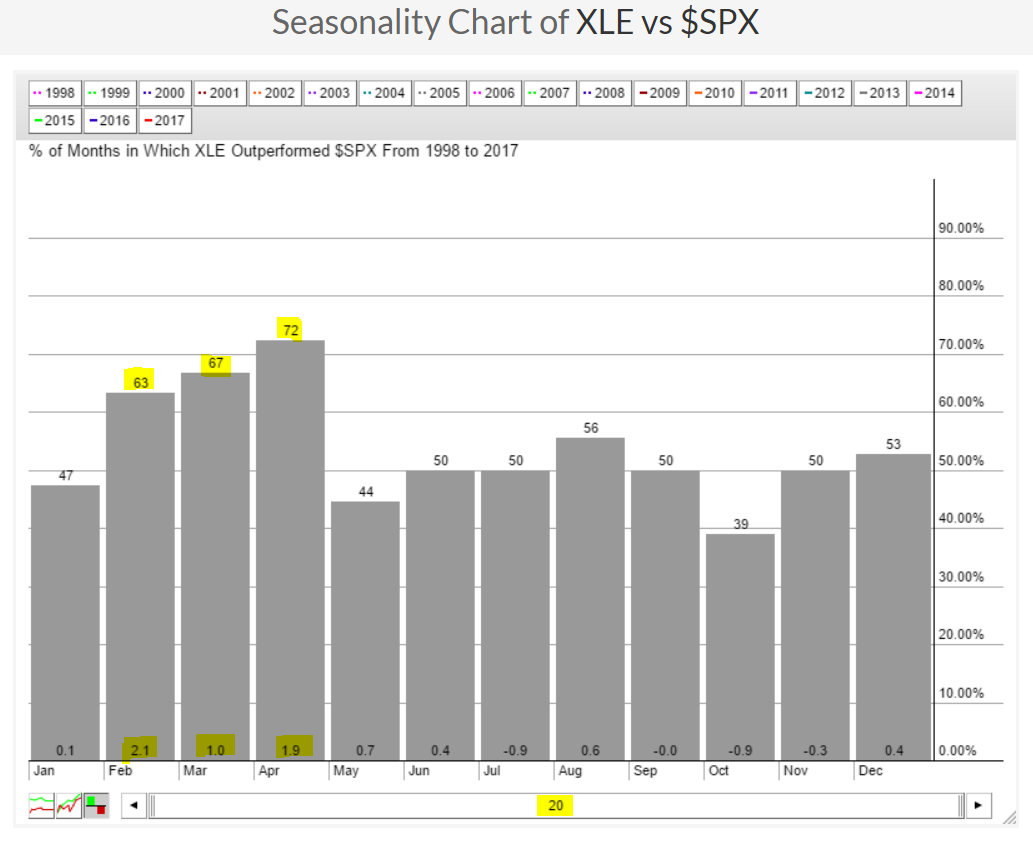 The above chart summarizes the relationship between the XLE and the benchmark S&P 500 over the past 20 years. February through April clearly show relative strength for energy - but this is looking in the rear view mirror, it does not guarantee us future outperformance. Therefore, pay attention to the key technical support range provided in the Sector/Industry Watch section above.
Key Earnings Reports
(actual vs. estimate):
CPB: .91 vs .88
DE: .61 vs .51
MCO: 1.23 vs 1.12
SE: .28 vs .33
SEP: .81 vs .80
SJM: 2.00 vs 2.00
VFC: .97 vs .97
XRAY: .67 vs .65
Key Economic Reports
January leading indicators to be released at 10:00am EST: +0.4% (estimate)
Happy trading!
Tom
