Market Recap for Friday, March 24, 2017
Friday was another day of bifurcated action with both the NASDAQ and Russell 2000 higher while the Dow Jones and S&P 500 lagged and finished lower. Sector performance wasn't any better with four sectors higher and five lower. To make matters worse, leadership was mixed between aggressive and defensive groups. The defensive utilities (XLU, +0.37%) sector was the best group and we've seen a breakout in this area in the past week. However, the XLU has printed a negative divergence, a sign of slowing momentum. Here's the chart:
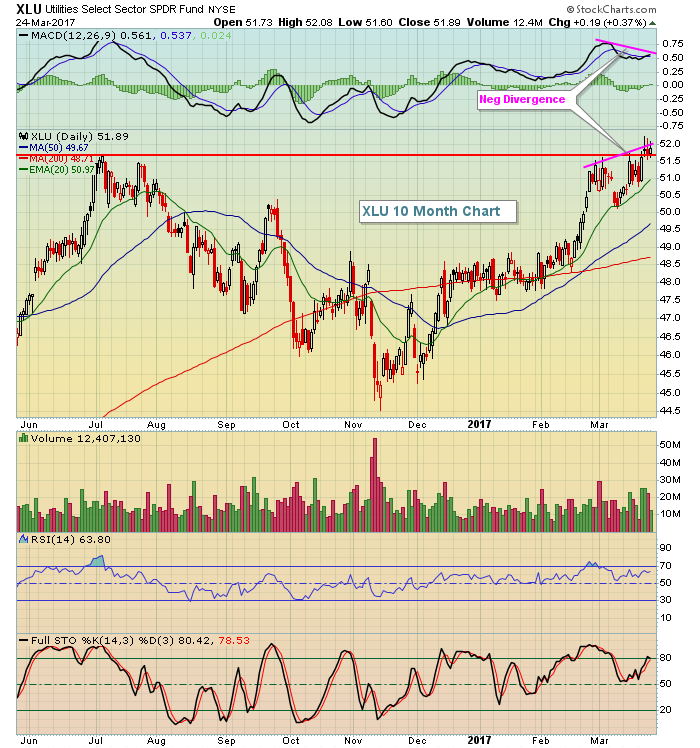 Utilities are somewhat driven by the direction of treasury yields. Currently, the 10 year treasury yield ($TNX) is mired in a period of consolidation between 2.30%-2.62%. A breakdown in the TNX, along with a breakdown in the U.S. Dollar Index ($USD) beneath 99, would likely provide a big boost to utilities. But until then, the jury is out.
Consumer discretionary (XLY, +0.24%) also performed well on Friday with the Dow Jones U.S. Footwear Index ($DJUSFT) rising nearly 2%. Nike (NKE) enjoyed a rebound off its recent earnings report which saw the stock fall. However, Skechers (SKX) rose 5.21% after an analyst upgrade and looks to extend its gain in the near-term.
Pre-Market Action
The Tokyo Nikkei ($NIKK) tumbled 277 points overnight amid a very weak dollar. The failure to pass revised healthcare legislation here in the U.S. appears to be the culprit according to most stock market watchers. That Asian weakness has carried over to Europe, where the German DAX ($DAX) is down nearly 1% this morning. Dow Jones futures are down 156 points with roughly 45 minutes left to the opening bell.
Current Outlook
A strengthening dollar ($USD) has been one of the hallmarks of this bull market and it's the first time that's happened since the late 1990s. Stock market strength has generally coincided with dollar weakness over the past couple decades. The following chart shows the dollar's longer-term correlation with the S&P 500:
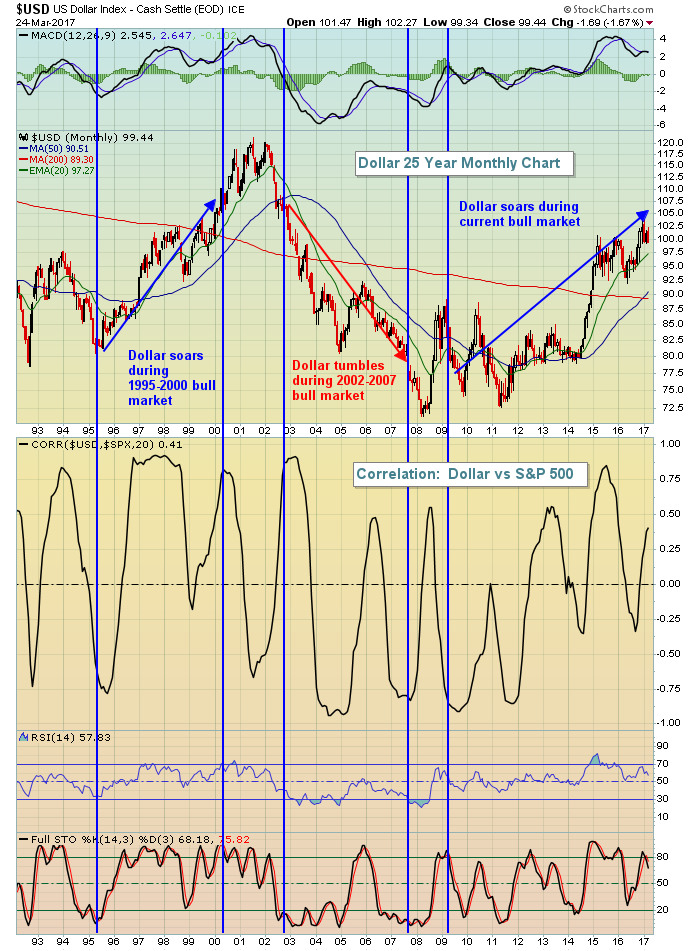 My first conclusion after reviewing this chart is that there's little correlation between the dollar and the S&P 500. Some bull markets occur with a rising dollar and some occur with a falling dollar. Still, the dollar and the S&P 500 have been rising together of late and over the past five years, the correlation factor has been mostly positive, suggesting the two are moving in the same direction. Therefore, a breakdown in the dollar should be seen as a negative for equities in my opinion. Here's the current look at the dollar on a shorter-term daily chart:
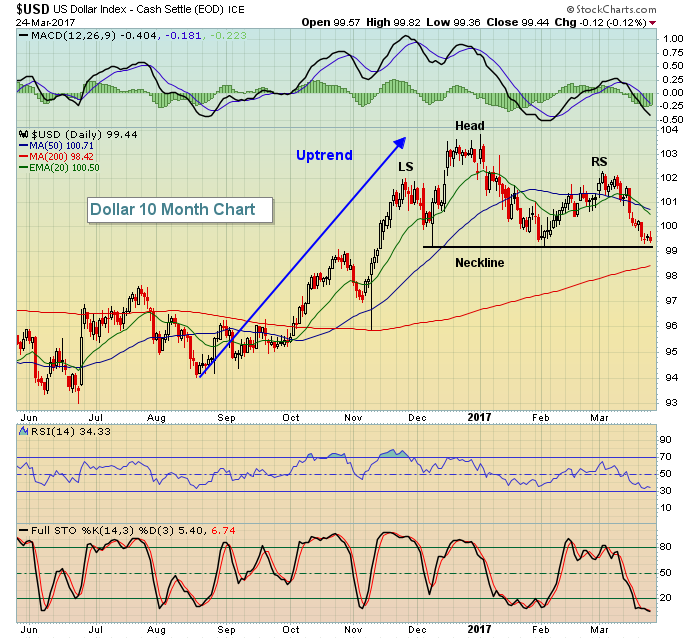 There's a clear potentially topping head & shoulders pattern on the dollar. A big drop in the dollar today would indicate further weakness ahead - a bullish development for gold.
Sector/Industry Watch
Gold ($GOLD) generally trades opposite the dollar so keep a close eye on the greenback. Should the USD fail to hold 99 support shown above in the Current Outlook section, gold would be poised to keep strengthening and clear its recent price high at 1265. Here's the chart:
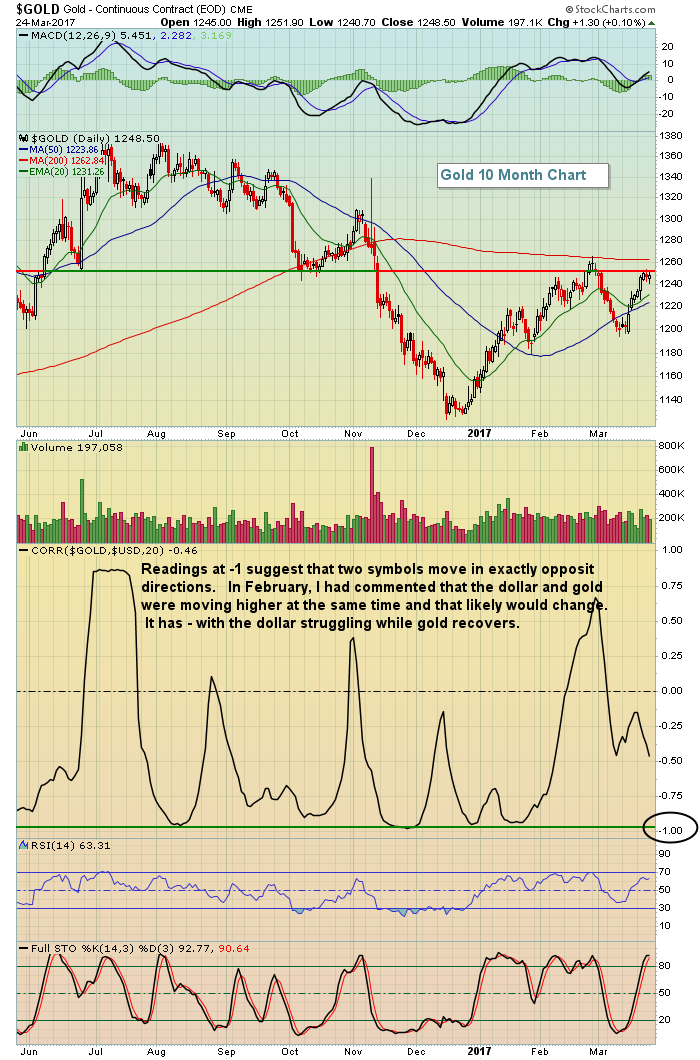 The 1250 level has been a key pivot level for many months and we're there again. Gold is up considerably this morning in pre-market trade so the recent high at 1265 may be under pressure before the day is done.
Monday Setups
Barricuda Networks (CUDA) will be reporting earnings in a couple weeks and in January reported excellent results. So will we see a pre-earnings run up in CUDA? I think we could, but it does require a bit more risk to enter now as there's always a threat of a pre-earnings warning. If you're willing to take that risk, CUDA could prove to be a nice trade. Here's the current chart:
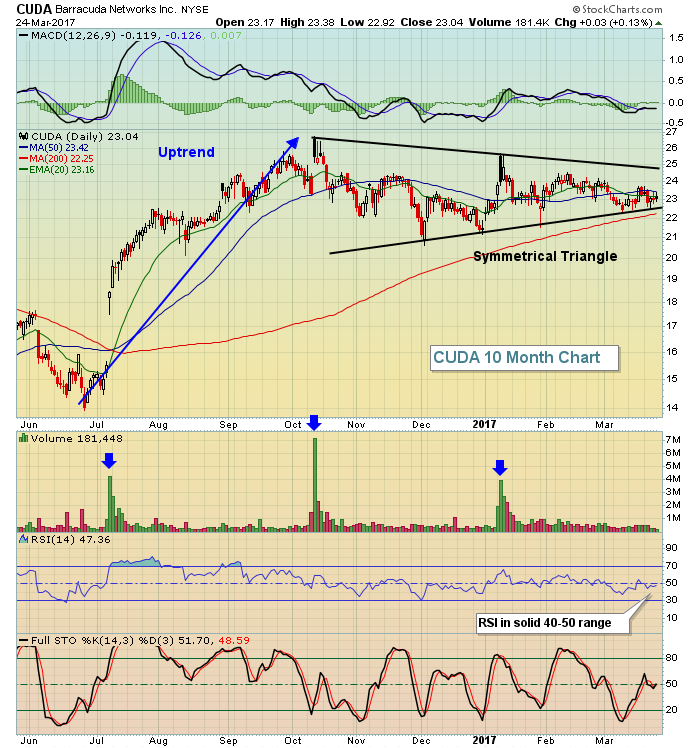 The symmetrical triangle is a bullish continuation pattern after the previous uptrend. Also, note that the prior three earnings reports have resulted in heavy volume gap ups (blue arrows).
Historical Tendencies
The strength we've seen in utilities (XLU) recently is actually a fairly normal event. March and April have been the two best months for utilities over the last two decades. Check out this seasonality chart:
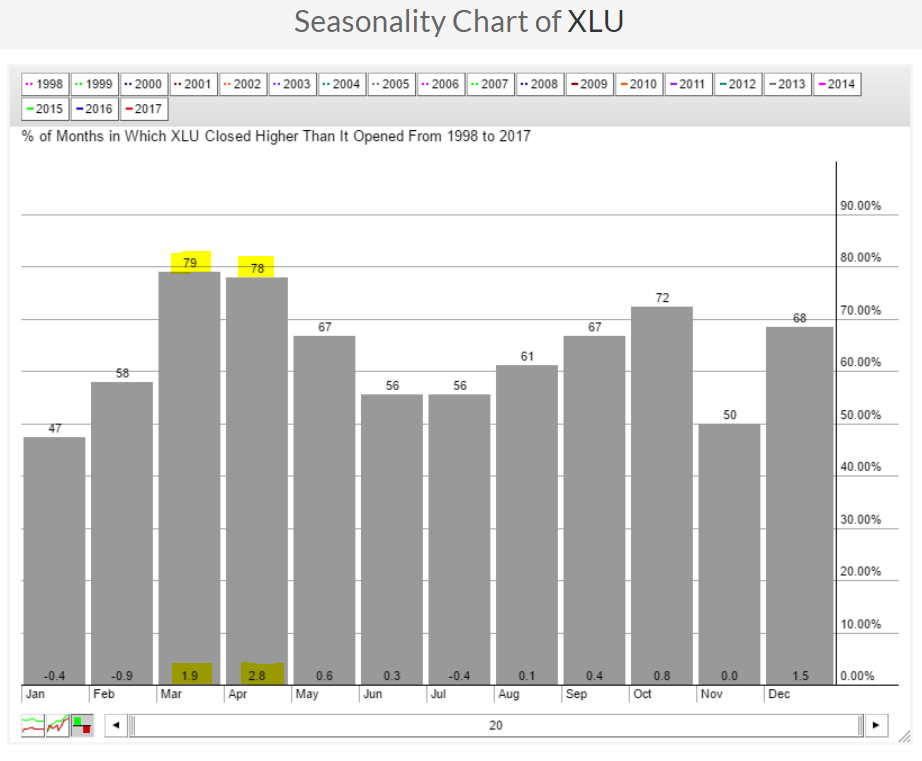 The yellow highlighted areas show that March and April provide the best chance for a rise in utilities. Also, the 1.9% average move higher in March and 2.8% average move higher in April are the two best months, barely eclipsing the average December move higher of 1.5%.
Key Earnings Reports
(reports after close, estimate provided):
RHT: .39
Key Economic Reports
None
Happy trading!
Tom
