Special Webinar Announcement
Please join me at noon EST for my Bowley Briefing webinar. It'll be a special one hour format and I'll be joined by Erin Heim. Many of you may know Erin from all of her Decision Point work here at StockCharts.com. We'll have a lively discussion of key market topics and trends just moments before Fed Chair Janet Yellen provides the latest announcement from the FOMC. You can CLICK HERE to register for today's FREE webinar.
Market Recap for Tuesday, March 14, 2017
It was mostly a day of profit taking as energy (XLE), -1.13%) was once again the relative laggard. Industrials (XLI, -0.94%) and materials (XLB, -0.86%) also posted sizable losses. Lower crude oil prices ($WTIC) have been mostly responsible for the tumbling XLE and this sector really needs a kick save at what I consider a very key pivot level. Take a look:
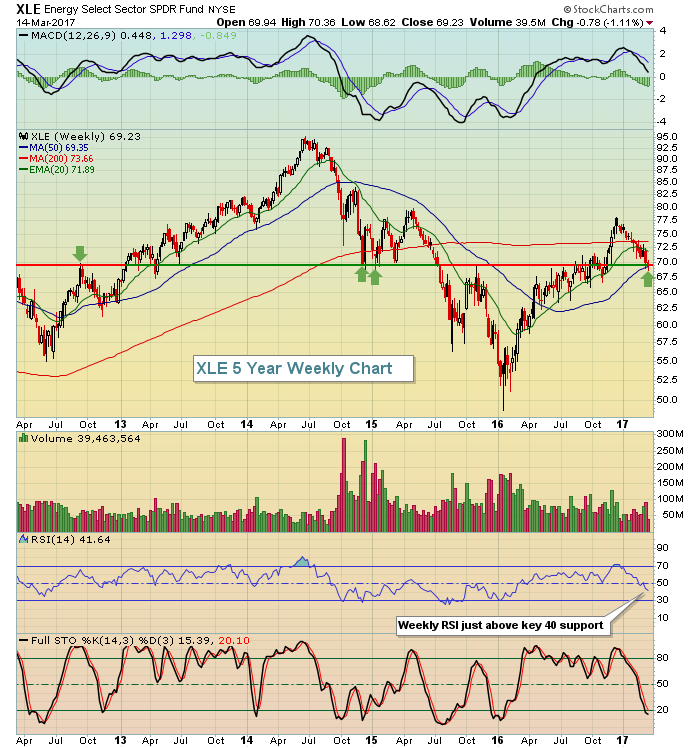 The long-term horizontal price support/resistance line is being tested currently from underneath and energy could use some buying late this week to further establish support near 70. During uptrends, weekly RSI support is typically found in the 40-50 range and currently the weekly RSI resides at 41. Energy needs to turn at the current level.
We could begin to see some sector rotation as technology (XLK) is printing a negative divergence on its daily chart at a time when it's also been quite overbought. Check this out:
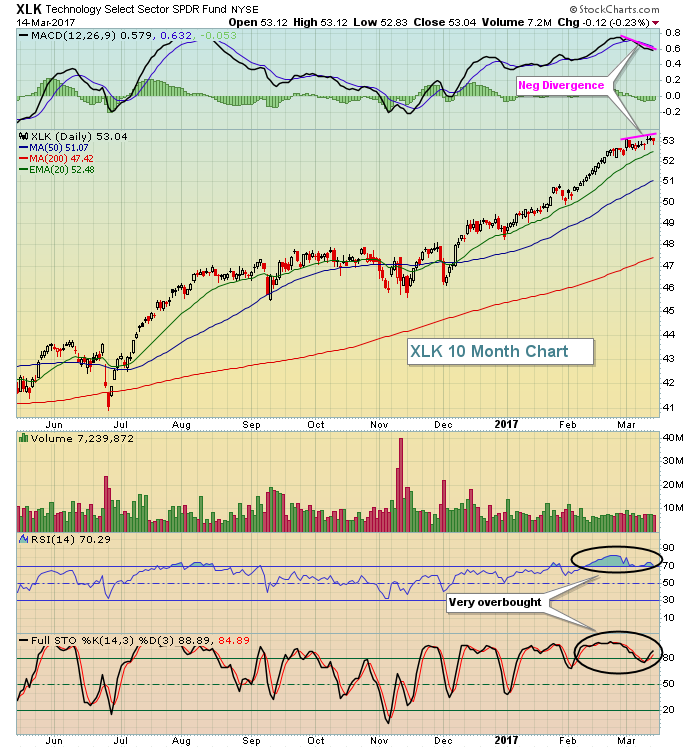 Keep in mind that negative divergences can be resolved by sideways consolidation, however, as steep selling doesn't always follow.
Pre-Market Action
There's a lot of news for traders to consider today. Of course, the biggest news will be the Fed's 2pm EST announcement on monetary policy. I believe it's a safe bet to see a quarter point rate hike, but with jobs accelerating, we'll have to see what kind of language the Fed uses in providing a future rate hike outlook. February CPI and retail sales, along with March empire manufacturing survey, were released this morning with mostly in line reports.
We saw mixed results in Asia overnight and in Europe this morning. But strengthening crude oil ($WTIC, +1.97% this morning) has Dow Jones futures higher by 32 points with a little more than 30 minutes to the opening bell.
Current Outlook
Everyone wants to know when the top is in, right? Well, every bear market seems to have different catalysts and it's difficult to predict what will be the catalyst of the next one. There has been one significant common denominator of the past two bear markets - higher expected volatility ($VIX). This makes sense to me. When the VIX is near historic lows, it handles bad news very well and it takes time to tear down that bullish environment. Take a look at the following chart of the VIX:
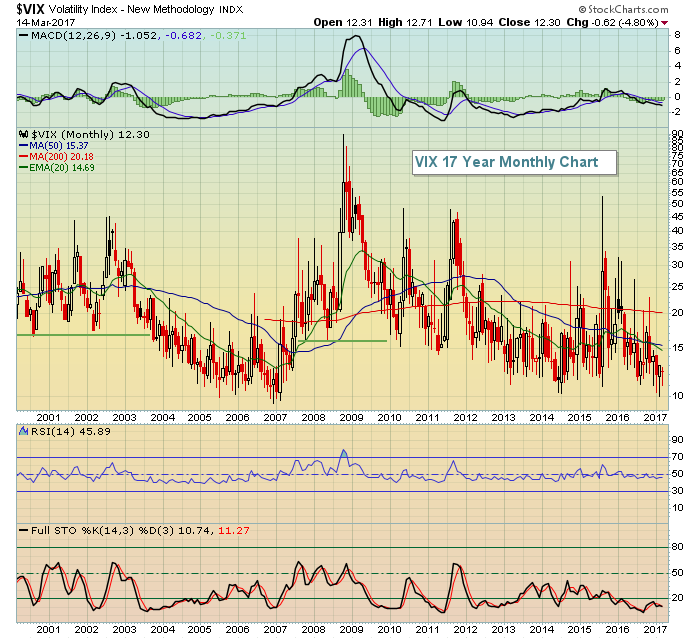 This chart dates back to 2000 and shows that the VIX was already elevated above 17 at the time the bear market started. In other words, cautiousness began before prices started falling. With the current VIX reading of 12.30, I believe it's premature to try to call the end of the current bull market. Let the market's behavior and environment dictate that for us.
Sector/Industry Watch
Technology has been a leading sector for sure, but you wouldn't know it by the awful performance of electronic office equipment ($DJUSOE) over the past three years. This group is now challenging a low not seen since the depths of the last bear market in 2009. Take a look:
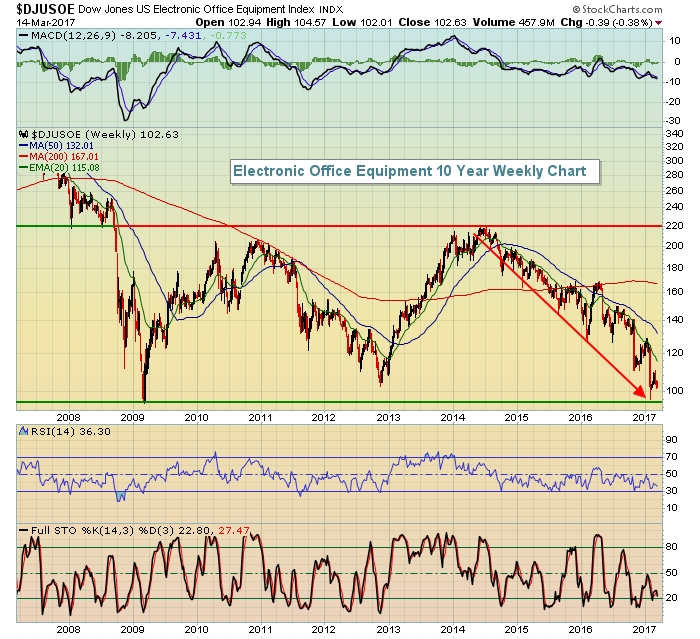 The battle lines here are clearly drawn and the DJUSOE needs to turn quickly. It's actually hard to believe that after 8 years of bull market action, the DJUSOE is where it was at the bear market low.
Historical Tendencies
The first couple days of calendar months are clearly the best days of the month in terms of stock market performance. But money flows tend to pick up in the middle of the month and it's reflected bullishly as well. Here are the NASDAQ's annualized returns for each of the calendar days from the 16th through 18th (since 1971):
16th: +39.22%
17th: +10.61%
18th: +21.21%
Key Earnings Reports
(reports after close, estimate provided):
JBL: .36
ORCL: .57
WSM: 1.52
Key Economic Reports
February CPI released at 8:30am EST: +0.1% (actual) vs. +0.1% (estimate)
February Core CPI released at 8:30am EST: +0.2% (actual) vs. +0.2% (estimate)
February retail sales released at 8:30am EST: +0.1% (actual) vs. +0.1% (estimate)
February retail sales ex-autos released at 8:30am EST: +0.2% (actual) vs. +0.2% (estimate)
March empire state manufacturing survey released at 8:30am EST: 16.4 (actual) vs. 15.4 (estimate)
January business inventories to be released at 10:00am EST: +0.3% (estimate)
March housing market index to be released at 10:00am EST: 66 (estimate)
FOMC meeting announcement 2pm EST
Happy trading!
Tom
