Market Recap for Monday, April 24, 2017
Global markets rallied on the heels of French election results and U.S. markets were no exception. We surged right out of the gate and didn't look back. The NASDAQ flirted with the 6000 level before settling for an all-time high close of 5983. The Russell 2000 nearly touched 1400 before it settled for a 1.31% gain, the best among our major indices. Check out the Current Outlook section below for a fresh breakout on the relative price chart of the Russell 2000 vs. the S&P 500 ($RUT:$SPX).
All nine sectors finished higher with financials (XLF, +2.25%) the obvious favorite among traders. Industrials (XLI, +1.42%) and technology (XLK, +1.18%) also performed extremely well and all three of these sectors are considered aggressive (or offensive) sectors.
Internet stocks ($DJUSNS) made a very nice breakout on the heels of a MACD centerline test so they could be poised for another big rally. Over the past 17 years, history has been kind to internet stocks during the month of May. Check out the Historical Tendencies section below. Here's the technical view on the group:
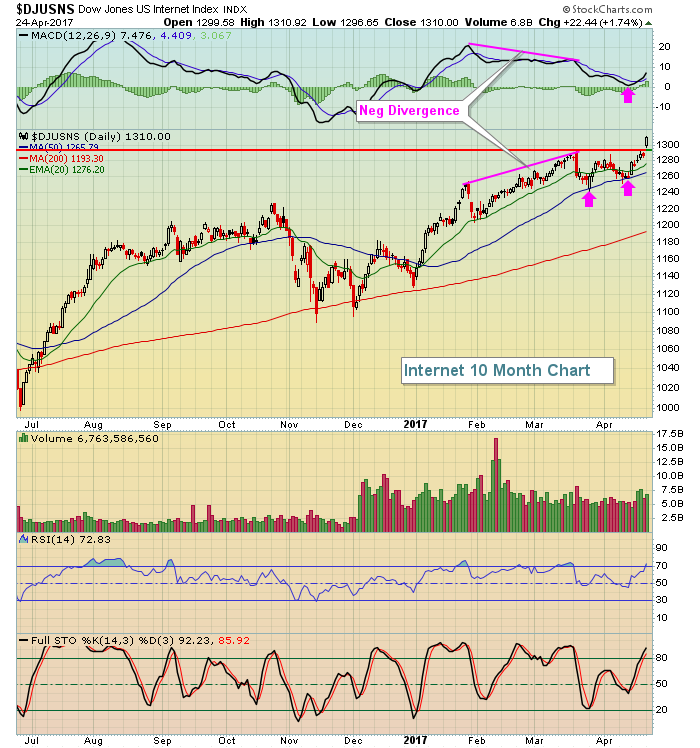 The DJUSNS is overbought, but it could remain overbought given that the MACD is just turning higher and we're approaching the time of the month where we typically see money inflows.
Pre-Market Action
Big gains overnight in Asia have global markets feeling very bullishly this morning here in the U.S. One key technical development yesterday occurred in Germany where the German DAX ($DAX) closed at an all-time high. That confirms the strength in the S&P 500 since November as there's a very strong positive correlation between the performance of the DAX and the performance of the S&P 500.
Earnings this morning are mostly positive and that's having a very strong positive influence on Dow Jones futures, which are up another 150 points at last check. Key Dow component stocks have reported excellent earnings and you can review those in the Key Earnings Reports section below.
Current Outlook
The Russell 2000's high yesterday was at 1400, still 1% or so from its recent high close of 1414. But the good news is that, on a relative basis, the Russell 2000 broke to a 7-8 week relative high vs. the S&P 500 and relative momentum is strengthening. That's a signal of bullish rotation and potentially a signal of a sustainable bull market rally underway. Here's the chart:
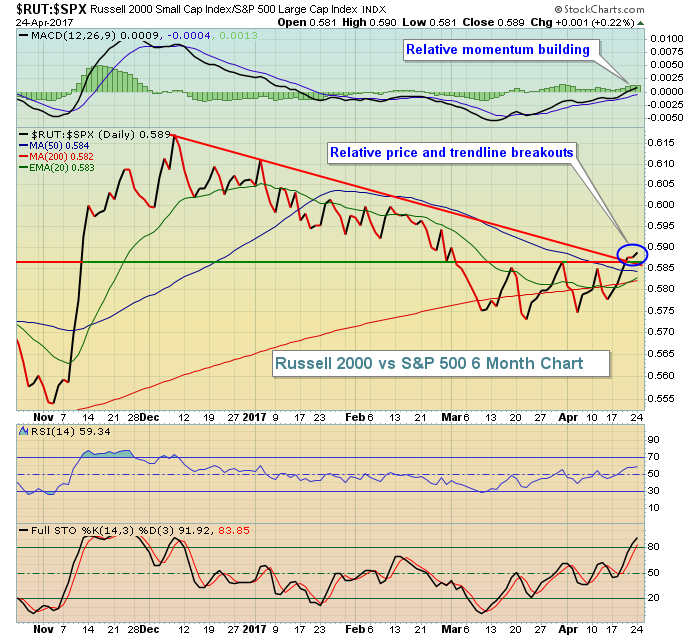 Continuation of this trend in the coming days and weeks would suggest this latest rally is just beginning.
Sector/Industry Watch
Financials (XLF) have been under pressure as the falling 10 year treasury yield ($TNX) had lessened the appetite for banks ($DJUSBK) and life insurance companies ($DJUSIL). Those were two of the leading industry groups within the financial sector and the market in general during the major November-December rally. The good news is that it appears a bullish wedge may have been broken on Monday to the upside, a very positive development technically. A move above 24 would confirm it in my view:
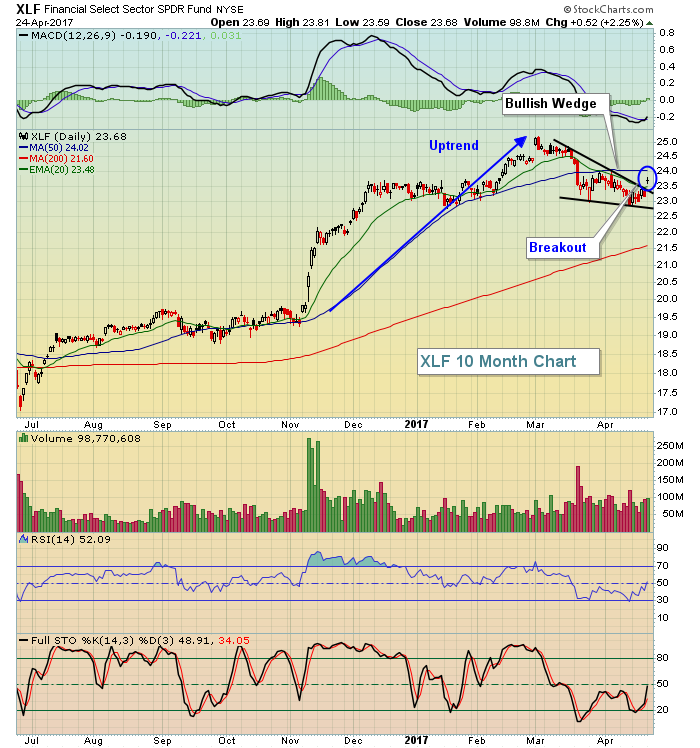 Previously, I was watching this chart for a possible head & shoulders top, but that would require a heavy volume breakdown beneath the neckline - approximately 22.90. A close back above 24.00 would clear the previous right shoulder and point much more towards a bullish outcome.
Historical Tendencies
The DJUSNS has been up each of the last five years during the month of May and has a very nice seasonal track record over the past 17 years. Check it out:
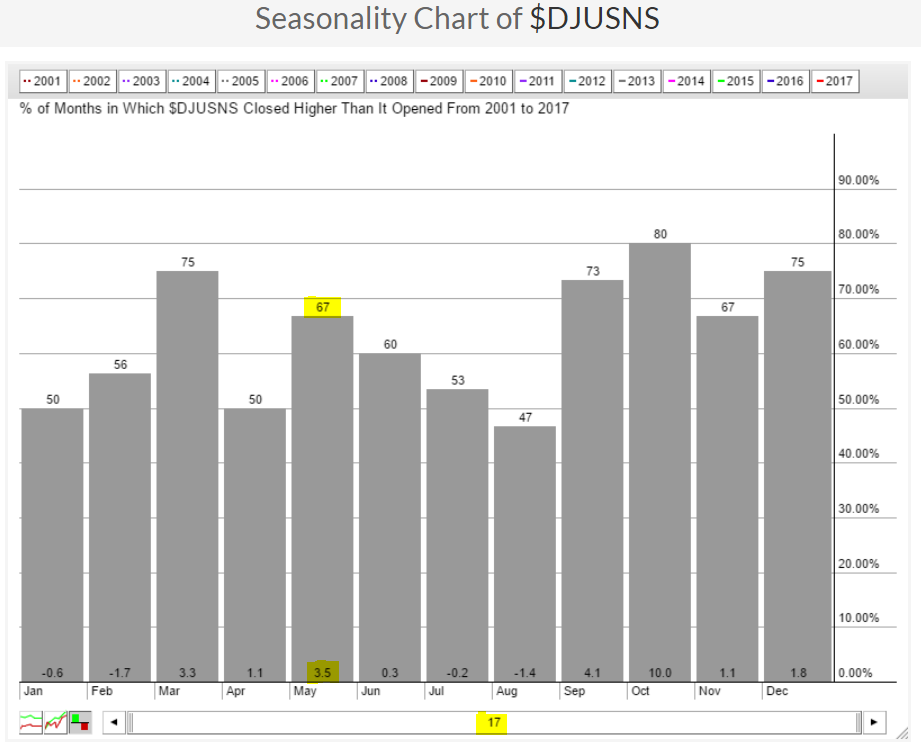 May is not the best month of the year for internet stocks, but it's very solid nonetheless. Just keep in mind the next few months after May are not historically strong.
Key Earnings Reports
(actual vs. estimate):
BHI: (04) vs (.21)
BIIB: 5.20 vs 4.97
CAT: 1.28 vs .62
DD: 1.64 vs 1.38
FCX: .15 vs .17
GLW: .39 vs .35
KO: .43 vs .44
LLY: .98 vs .96
LMT: 3.00 vs 2.76
MCD: 1.47 vs 1.32
MMM: 2.16 vs 2.07
NVS: 1.13 vs 1.10
SAP: .46 vs .57
VLO: .68 vs .60
(reports after close, estimate provided):
AMX: .32
CB: 2.43
CMG: 1.27
COF: 1.93
DFS: 1.42
EW: .82
ILMN: .64
SYK: 1.43
T: .74
TXN: .83
Key Economic Reports
February FHFA home price index to be released at 9:00am EST: +0.4% (estimate)
February Case Shiller Index to be released at 9:00am EST: +0.8% (estimate)
March new home sales to be released at 10:00am EST: 588,000 (estimate)
April consumer confidence to be released at 10:00am EST: 123.1 (estimate)
Happy trading!
Tom
